

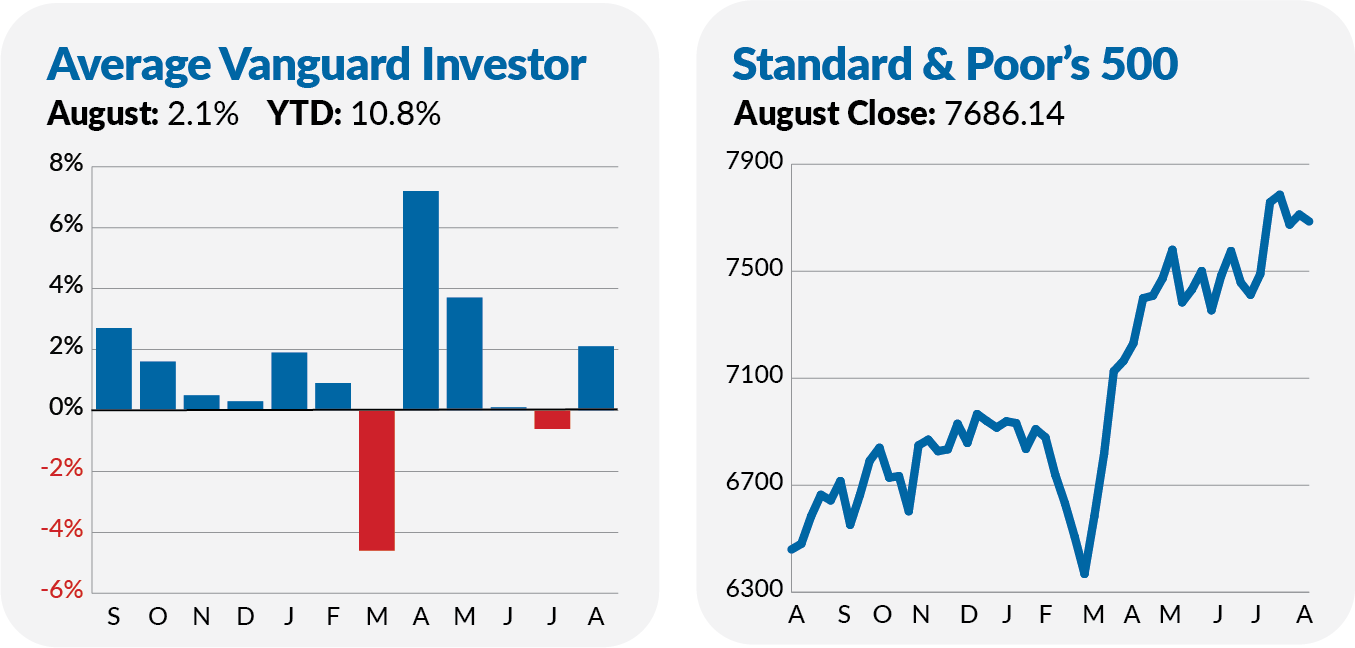
The leaves are beginning to turn, and there's a chill in the air. Could we be heading for a chill on Wall Street, as well?
Stocks of nearly all shapes and sizes ended the summer on a positive note. After two months of losses, 500 Index (VFIAX) gained 2.7% in August. SmallCap Index (VSMAX) and Total International Stock Index (VTIAX) also delivered, with gains of 1.4% and 3.1%, respectively.
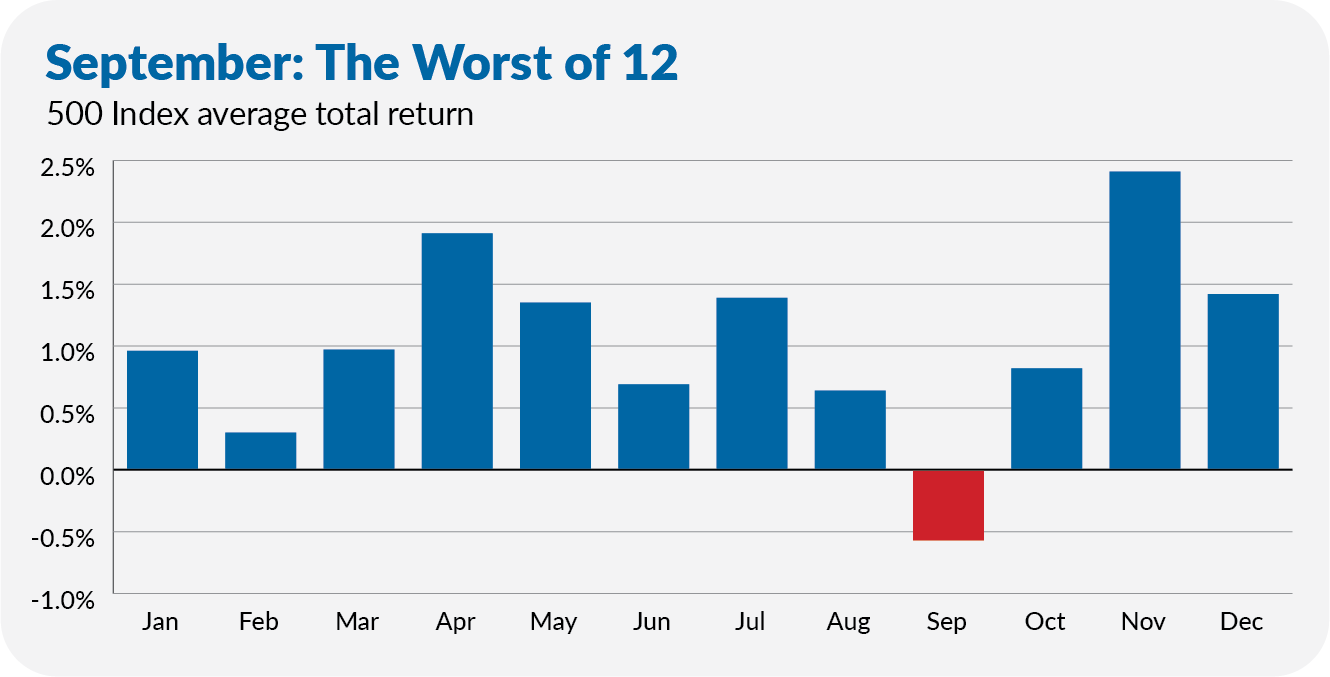
But we're entering September, which is historically the worst month for stocks. October gets the bad reputation—those of us with years in the markets have lived through a few brutal ones—but as the chart below shows, September is the only month when stocks have, on average, declined.
Over the past 50 Septembers, 500 Index has averaged a 0.6% loss. The flagship index fund gained ground 26 times—or just half the time.
In statistics, data mining is a cautionary term. It means that if you analyze enough data, you’ll eventually find some pattern. Or, to say it differently, if you throw enough spaghetti on the wall, some of it will stick!
I can’t think of a good explanation for why September should be the worst month of the year, which means this pattern is likely a data-mined “gem.” Expect the financial press to lean into the “worst month” narrative over the next few weeks—but, no, you don't need to dig out your winter coat just because the calendar flipped from summer to fall.
The Bond Rout That Wasn't
This past month’s almost daily headlines told of a bond market rout. From a start at 5.28%, the yield on the 30-year Treasury reached 5.34% intraday on August 18—its highest level since 2007. That’s newsworthy. But remember, the news media’s goal is to entertain, not to inform.
Falling prices go hand in hand with rising yields, so you'd expect real damage among bond funds—particularly those holding the longest-maturity bonds. Yet Extended Duration Treasury ETF (EDV) was Vanguard’s best-performing bond fund in August, gaining 1.2%. Long-Term Treasury ETF (VGLT) and Total Bond Market Index (VBTLX) gained 0.8% and 0.4%, respectively.
How do we explain this disconnect between two-decade high yields and bond market gains?