What a difference three days can make.
If May had ended on the 28th, I’d be talking to you about how the bull market was in full swing. After all, in the 22 trading days since April’s end, the S&P 500 index had not only recovered from April’s pullback but hit new highs, the Dow Jones Industrial Average closed above 40,000 for the first time, and the Nasdaq hit multiple highs powered by Nvidia’s 30% gain. (Apple’s and Microsoft’s double-digit gains also helped.)
But big tech’s unrelenting march higher tripped up in the final days of the month. Information Technology ETF (VGT) fell 2.8% in May’s final three days. Salesforce lowered its outlook and lost 20% on Thursday, leading the way down. However, most of the damage was contained to the tech sector. For example, SmallCap Index (VSMAX) gained 0.4% in the final three days.
Time will tell if the last few trading days are the beginning of a new trend or simply a momentary misstep for technology stocks.
Either way, the history books will look back at May and see a market driven by big technology stocks. 500 Index (VFIAX) gained 5.0% in May, while SmallCap Index only gained 4.0%. And, Information Technology ETF, despite stumbling at the finish line, was still Vanguard’s third-best-performing fund, with an 8.1% return.
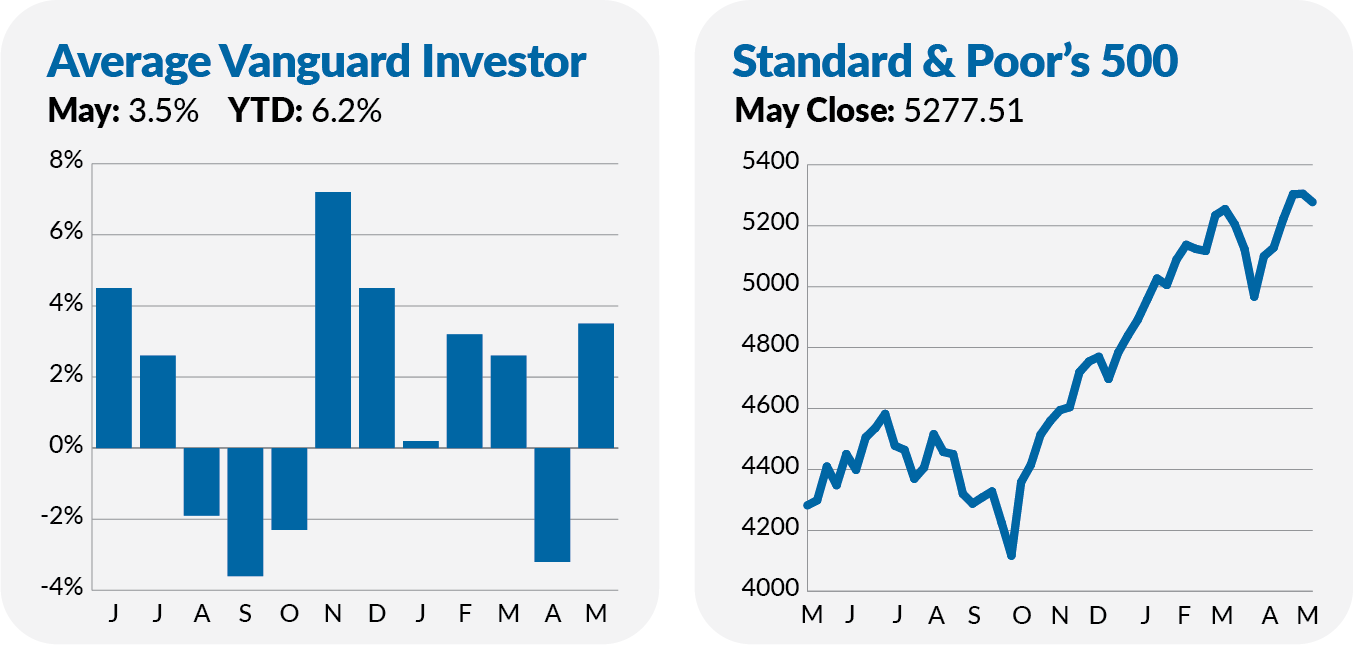
Despite the decline at May’s end, if we take a slightly bigger step back and consider the first five months of the year, the stock markets have been remarkably calm. The S&P 500 index's standard deviation (a common measure of volatility) has been 11.3%. That’s the lowest calendar-year standard deviation since 2017 and well below the index’s typical volatility of 16%.
Of course, we’ve got seven more months to go in 2024 and an election to get through, so let’s not break out the confetti just yet. The narrative could change. But the lack of volatility and abundance of complacency is showing up in the VIX index.
The VIX index, often called the fear gauge, doesn’t directly measure volatility; it measures what traders think volatility will be.
It received considerable attention during the Global Financial Crisis (2008 to 2009) and the COVID-19 lockdown as it soared to an unheard-of 82.69. But the VIX recently re-entered the conversation when it fell to 11.86—the lowest level since COVID. Yes, the VIX ticked higher to end May at 12.92, but this year, it has averaged just 14.09—the lowest calendar-year average since 2017.
As you can see in the chart below, the VIX and actual volatility tend to move together.
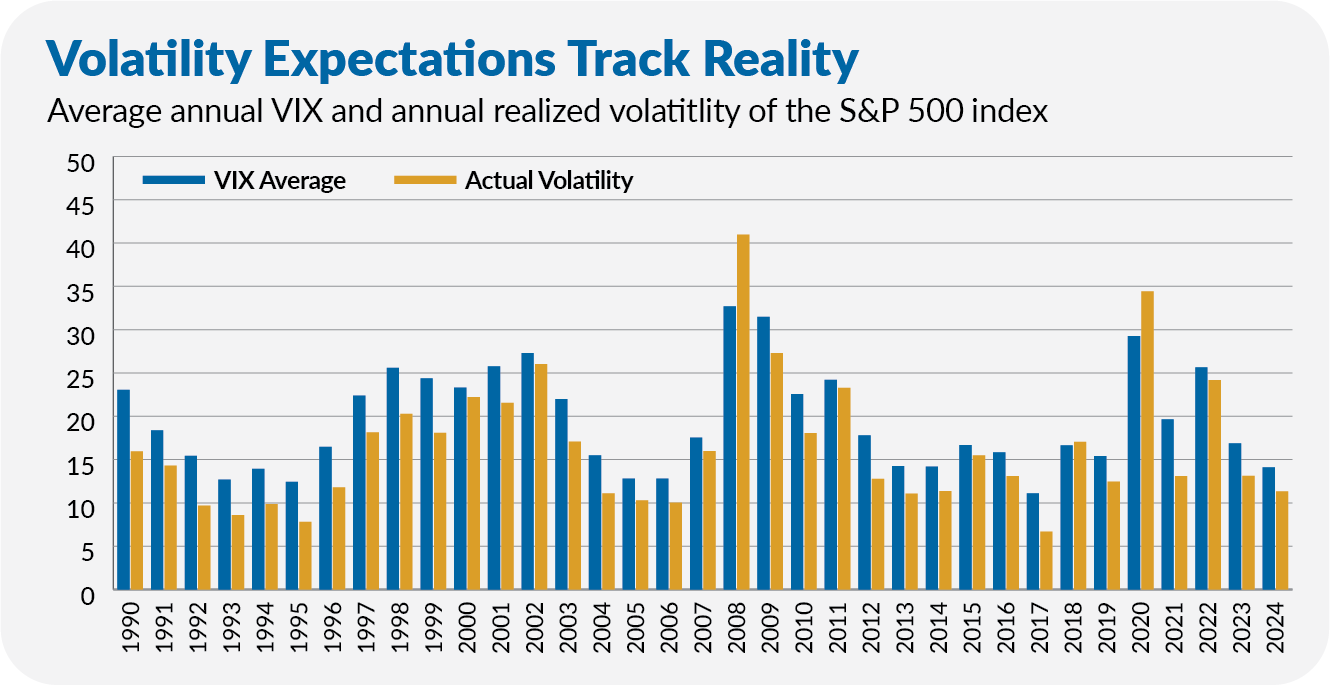
Another lesson from the chart above is that markets are rarely at an “average” volatility level. More often, volatility is at one extreme or the other. (On an annual basis, the VIX has run at 19.4.) This means that today’s low level of volatility will end, and volatility will spike.
Maybe volatility has started to spike. Or perhaps not—markets could calm down and stay that way for months and months. Still, it’s better to prepare for higher volatility now.