Executive Summary: Gold and commodities can diversify a portfolio—but owning them demands patience and discipline. Over 50 years, swapping some bonds for hard assets delivered similar returns, not miracles. For most investors, the traditional stock-and-bond framework remains simpler and easier to hold through the ups and downs.
The other week, I shared a chart showing how stocks had outpaced gold by a country mile (or two) over the past five decades. A few IVA readers wrote in asking a natural follow-up question: How does gold compare to bonds?
With bonds under pressure over the past few years, that question has taken on new urgency. One reader put it this way:
Some ”experts” recommend adding gold to an individual’s portfolio. Morgan Stanley recommends shifting from the traditional 60/40 portfolio to a 60% stocks, 20% fixed income and 20% gold portfolio. According to one article, Ray Dalio recommends reducing exposure to Treasuries in favor of gold, between 5-15%.
As these positions trade fixed income for gold, I’d like to see a historical performance comparison between bonds and gold in a future article.
That’s a great question. So let’s do exactly that.
In this article, I’ll compare gold to stocks, bonds and cash over time. Then we’ll step back and ask the more important question: Does gold actually earn its keep in a diversified portfolio?
I’ll also broaden the lens beyond gold to include commodities more generally. Why? Two reasons. First, I’m almost always biased toward more diversified solutions. Second, Vanguard doesn’t offer a gold fund—the old Precious Metals & Mining fund was recast as Global Capital Cycles (VGPMX) in 2018. (You can read about that fund here.) However, Vanguard turned around and launched Commodity Strategy (VCMDX) in 2019.
Before we dive in, let me be transparent about where I’m at as I start this analysis.
To me, investing means owning productive assets—pieces of businesses that grow, innovate and contribute to human progress. Gold and commodities don’t do that. They don’t generate earnings, cash flow or dividends. So, instinctively, they’re not what I want to be invested in for the long run.
That said, I’ll do my best to set that bias aside and, as I always do, approach the data with an open mind.
Housekeeping
This analysis begins with the 1976 launch of 500 Index and relies on investable, real-world data wherever possible. Full methodological details are provided in the appendix, but here’s a quick overview of the inputs:
- Stocks: 500 Index
- Bonds: A mix of Long-Term Investment-Grade and Cash Reserves Federal Money Market early on, transitioning to Total Bond Market Index in 1987 upon its inception
- Cash: Cash Reserves Federal Money Market
- Commodities: Bloomberg index data until the launch of Commodity Strategy in 2019
- Gold: World Bank gold price data until SPDR Gold Trust ETF (GLD) starts trading in 2005
All returns are total returns, assuming the reinvestment of all distributions.
One final note: I’ve intentionally left Bitcoin—often described as “digital gold”—out of this discussion. Cryptocurrencies don’t have the history, track record or real-world utility of gold or commodities. In my view, they belong squarely in the speculation bucket, not the portfolio-construction conversation.
Five Decades of Performance—How the Assets Stack Up
Let’s start by looking at each asset on its own merits.
The chart below shows how stocks, bonds, cash, commodities and gold have performed over the past five decades. I’ve also included inflation, since “inflation protection” is often cited as a primary reason to own gold or commodities. This is a long-term comparison—not a verdict on the last few years.
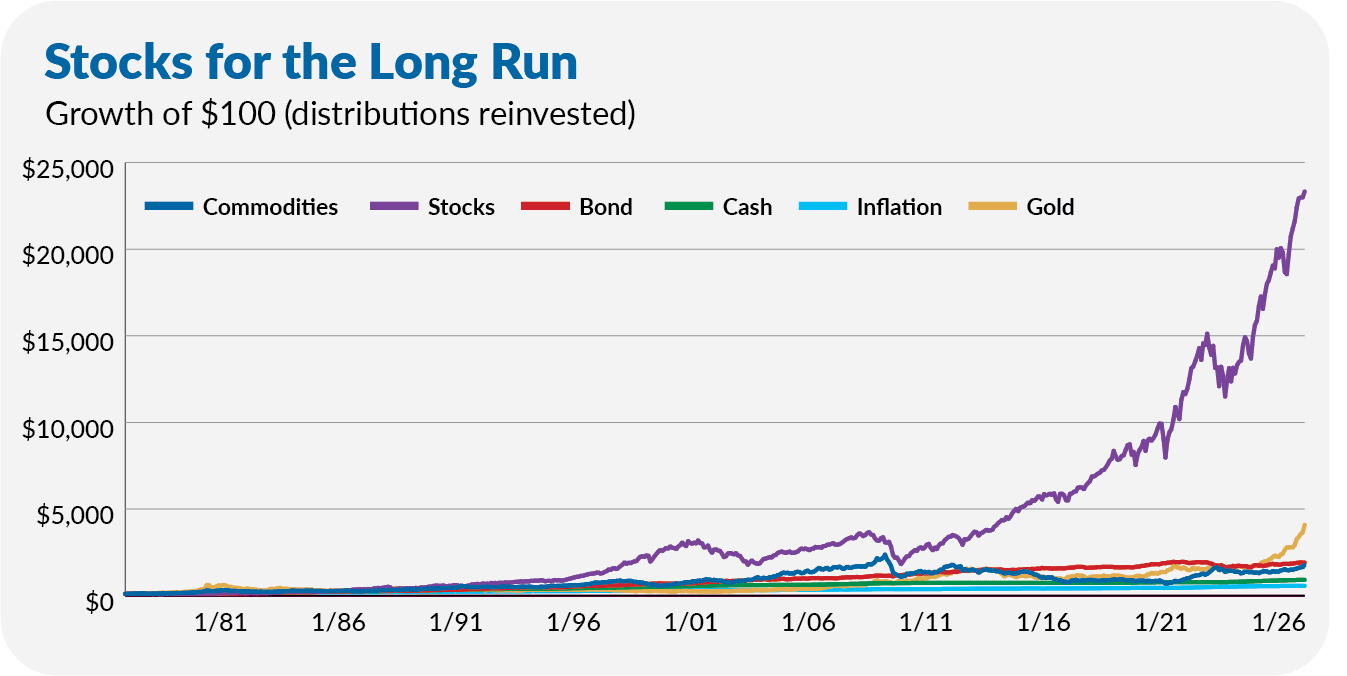
To put some numbers around the chart, here are the annualized returns between August 1976 and January 2026 (in descending order):
- Stocks: 11.7%
- Gold: 7.8%
- Bonds: 6.2%
- Commodities: 6.0%
- Cash: 4.6%
- Inflation: 3.6%
The takeaway is straightforward. If your goal is to protect purchasing power and build wealth over time, nothing comes close to stocks.
Now let’s remove stocks from the picture so we can better see what’s going on between bonds, cash, commodities, gold and inflation.