Hello, and welcome to the IVA Weekly Brief for Wednesday, May 7.
There are no changes recommended for any of our Portfolios.
Stock markets picked up in May where they left off in April. After notching gains on April’s last seven trading days, the 500 Index (VFIAX) gained ground on May 1 and 2. The flagship index fund gained 10.2% over nine trading days.
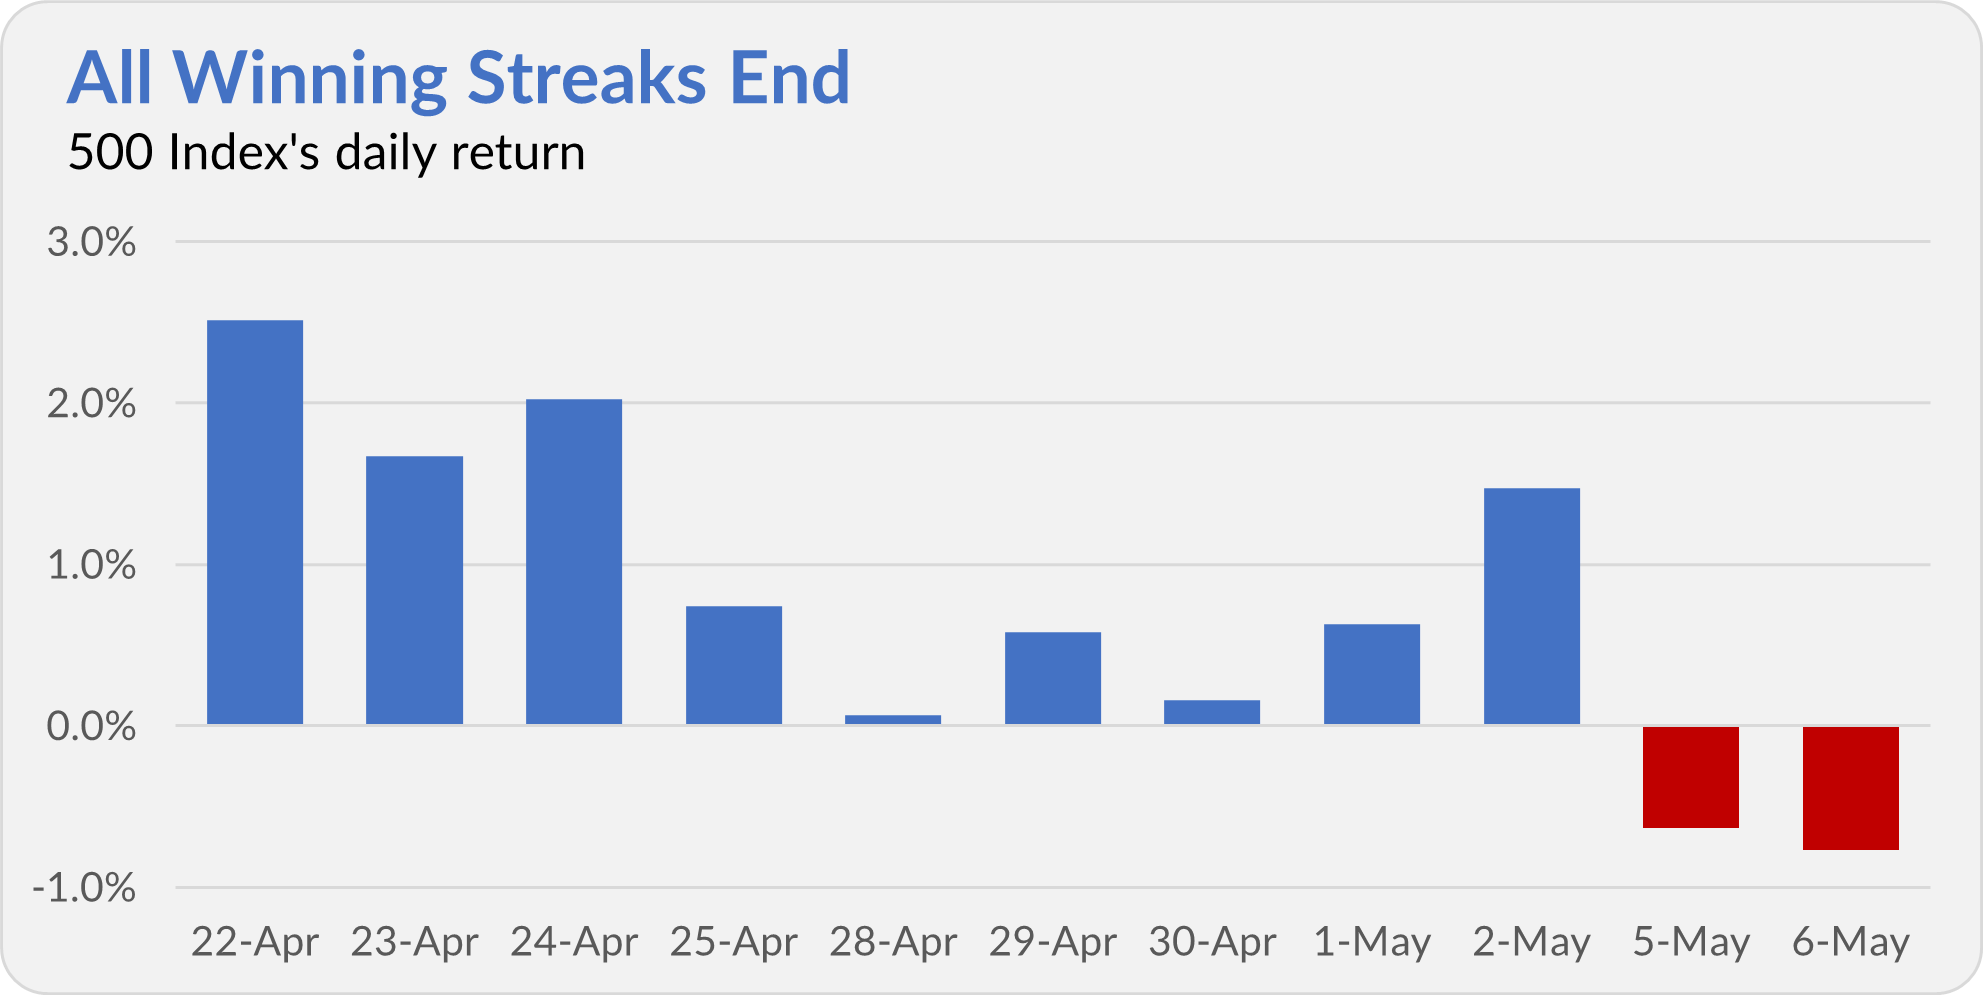
These streaks give headline writers something to latch on to, but for long-term investors, they are noise.
Of course, all streaks end, and 500 Index dropped 1.4% on Monday and Tuesday. (As I write this Brief, the S&P 500 index is up around 0.5% today.)
Imports Do Not Subtract
After 11 consecutive quarters of growth, the Bureau of Economic Analysis (BEA) reported last week that the U.S. economy (measured by Gross Domestic Product, or GDP) shrank by 0.1% in the first quarter. (The -0.3% headline figure quoted in the press is an annualized number.) In dollars and cents, the economy contracted by $16 billion to $23.5 trillion.
This was an initial estimate and will almost certainly change in the coming months, but it did give pause.
If you read about the report in the media, chances are you walked away with the impression that imports were a drag on GDP. Most articles I read said something to the effect of “imports subtract from GDP.” Heck, even the BEA’s report includes a chart like the one below that makes it appear that imports subtract from GDP.
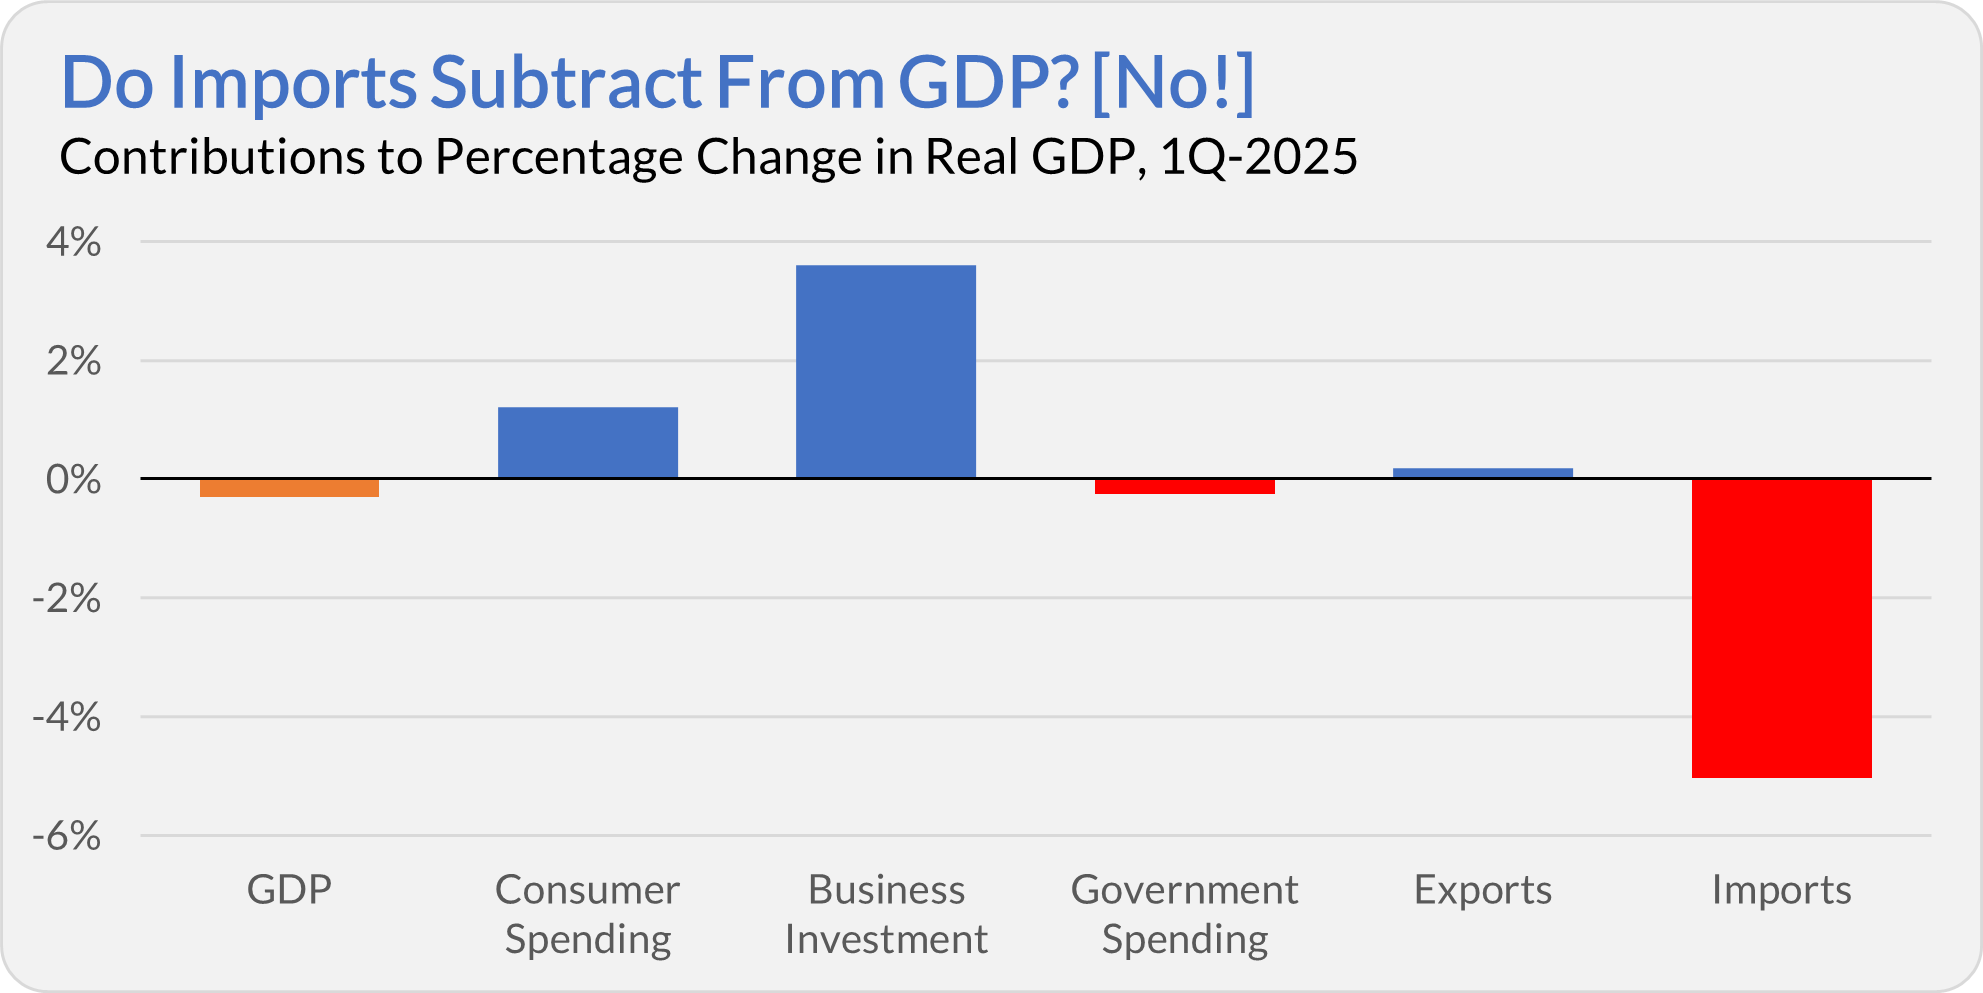
But this is wrong. Repeat after me: Imports do not subtract from GDP.
GDP stands for gross domestic product—it measures how much is produced in our country (the U.S.). The BEA calculates GDP by totaling consumer, business, and government spending. However, that total must be adjusted for exports and imports because not everything produced in the U.S. is sold within its borders (some of it is sent overseas), and not everything we buy is “Made in America.”
For example, if I buy a $1,000 television from South Korea (think Samsung), it counts as $1,000 of “consumer spending” and $1,000 of imports—so they cancel out.
The same goes if Walmart purchases that television to build its inventory. It counts as $1,000 of business “investment” and $1,000 of imports—again, they cancel out.
I know this is in the weeds, but most of the reporting on this is wrong, and one goal here at The IVA is to make you a better-informed investor.
So, now that you know the real story behind GDP and imports, what are we to make of the negative GDP report?
First, don’t be surprised if this figure is revised upward as we gain a more accurate read on inventories.
Second, and more importantly, while the actual impact of tariffs is just beginning to show up in the numbers, the threat of tariffs has already influenced consumer and business behavior. Both groups rushed to purchase foreign goods in advance, hoping to sidestep new costs. The front-loading likely inflated first-quarter figures—and could result in less consumer and business spending and fewer imports in the second quarter.
If that’s how things play out, we may be in for another quarter of negative GDP growth.
The bottom line is that tariffs are distorting the economic data, making GDP noisier and harder to interpret than usual.
Bessent Barometer
Speaking of the economy, Treasury Secretary Scott Bessent wrote in an opinion piece in The Wall Street Journal over the weekend that,
The American people should expect to hear the [economy’s] engine humming during the second half of 2025. With all pistons moving, we’ll see more jobs, more manufacturing, more growth, a more robust national defense, higher wages, lower taxes, less-burdensome regulation, cheaper energy, less national debt and less dependence on China—all while maintaining a strong dollar.
I certainly hope Bessent’s forecast is accurate—who wouldn’t want those things for the country?
However, I thought it would be interesting (or “fun”) to hold him to his forecast, so I went through his list of “mores” and “lesses” and identified clear, trackable data points where I could. I couldn't find reliable metrics for a few areas—like national defense and regulation—so I’ve set those aside.
The table below presents the most recent data available as of Sunday, May 4, when Bessent’s article was published. I’ll revisit these indicators toward the end of the year to evaluate how his predictions held up. (I’ve included links to the data sources in the footnote.)
| Bessent's Forecast | Data Point | As of 5/4/2025 |
|---|---|---|
| More jobs | Civilian labor force, total employed | 171,109,000 |
| Unemployment rate | 4.2% | |
| More manufacturing | ISM Manufacturing PMI | 48.7 |
| Industrial Production: Manufacturing Index | 100.5 | |
| Manufacturers' New Orders: Durable Goods (millions) | $315,659 | |
| More growth | Real GDP (Q1 first estimate, billions) | $23.526 |
| 12-month change in real GDP | 2.0% | |
| Higher wages | Average hourly earnings of All Employees (private) | $36.06 |
| Compensation Received: Wages and salaries (billions) | $12,764 | |
| Cheaper energy | WTI crude oil | $58.55 |
| Less national debt | National debt (trillions) | $36.215 |
| Total public debt as % of GDP | 122% | |
| Less dependence on China | U.S. Imports of Goods from China, Last 12m (millions) | $444,534 |
| Strong dollar | ICE US Dollar Index | 100.4 |
I track these metrics regularly (the exception being imports of goods from China), so Bessent's commentary provides a framework for evaluating the administration's economic policies and performance. Interestingly, “lower prices” (or less inflation) is missing from his curated list, but I’ll stick to his chosen benchmarks for this accountability exercise.
Every Basis Point Counts
Speaking of accountability… last week, I commented on the “zero-fee” index fund trend and noted that Vanguard was the most expensive option I listed. One sharp IVA reader pointed out that I had omitted Total Stock Market ETF (VTI), which carries a 0.03% expense ratio—one basis point cheaper than its Admiral share class sibling, VTSAX (0.04%).
I've updated the chart to include VTI and its 0.03% fee.
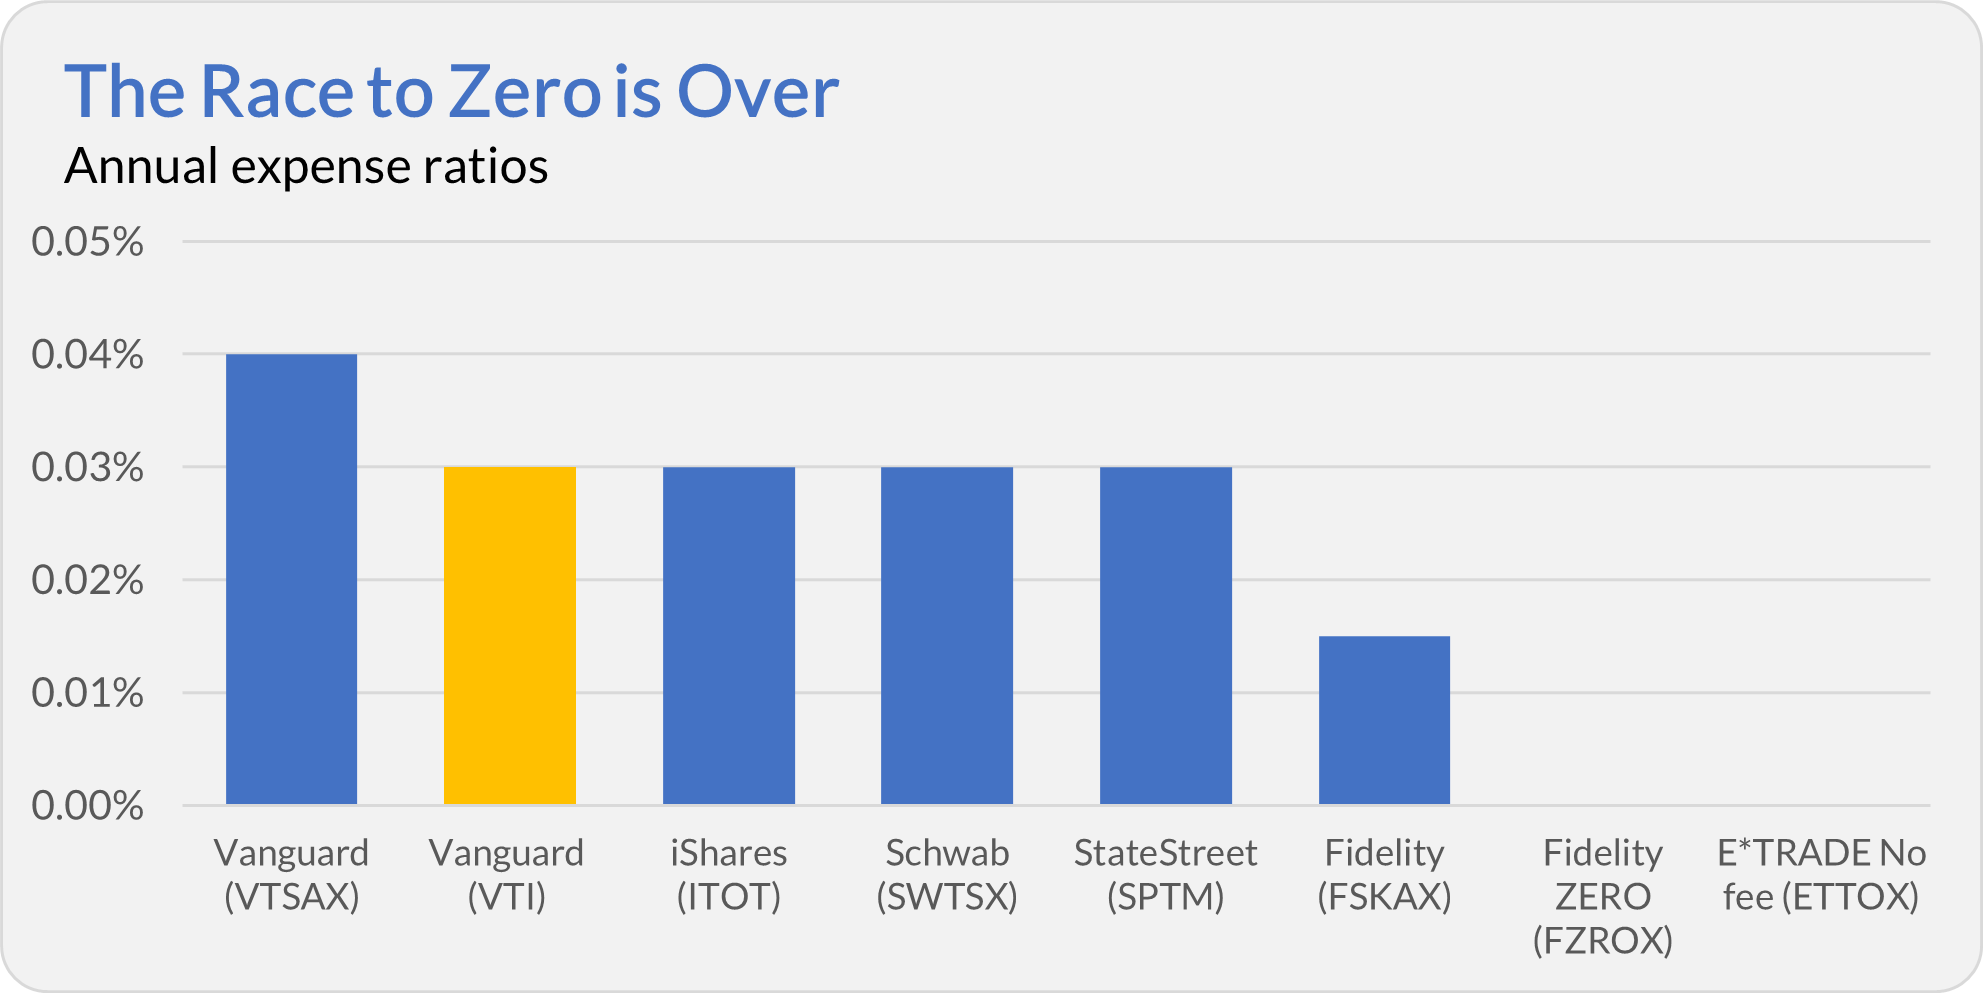
With that addition, the picture changes slightly. Vanguard is no longer the most expensive in the group—its ETF is tied with iShares, Schwab, and State Street at 0.03%.
My point still stands. Vanguard is the low-cost leader–and the reason we’re talking about near-zero expenses at all—but it’s no longer always the cheapest option. Investors today can find market-cap-weighted index funds that match or even beat Vanguard’s pricing.
The race to zero is over. Now we’re all quibbling over basis points.
Accountability II
Vanguard recently released the latest predictions from its much-vaunted Vanguard Capital Markets Model, which reportedly runs 10,000 scenarios each to generate 10-year forecasts for various investment sectors, including growth stocks, REITs, emerging markets and bonds.
Five years ago, Vanguard predicted U.S. stocks would return between 5.5% and 7.5% annually. S&P 500 ETF (VOO) compounded at an 18.5% annual rate! Growth stocks? 4.0% to 6.0%. The reality: 19.5% per year. And on and on.
Does this mean that, based on the predictions made five years ago, U.S. stocks will fall 4.3% per year, growth stocks will decline 7.8% per annum, or large stocks will drop 4.5% annually? Those are the returns “required” for each fund to hit the midpoint of Vanguard’s March 2020 10-year forecast.
I’m willing to bet that cash won’t lose 0.4% per year over the next five years, which means Vanguard’s 2020 prediction on cash will fall short of the actual returns.
As for the economy, will inflation turn into wicked deflation? If prices fall 2.3% per year over the next five years—which is what would have to happen to hit Vanguard’s 2020 forecast of 1.5% annual inflation—well, we’re probably headed for a major recession (if not a depression).
I could go on.
| Asset | Vanguard's Mar. 2020 10-Year Forecast Range | Midpoint of Mar. 2020 Forecast | Fund | 5-Year Return as of Mar. 2025 | "Required" 5-Year Return to Hit 2020's Midpoint | Midpoint of Mar. 2025 10-Year Forecast |
|---|---|---|---|---|---|---|
| U.S. stocks | 5.5%–7.5% | 6.5% | VOO | 18.5% | -4.3% | 5.4% |
| U.S. value | 7.6%–9.6% | 8.6% | VTV | 17.1% | 0.8% | 7.0% |
| U.S. growth | 4.0%–6.0% | 5.0% | VUG | 19.5% | -7.8% | 4.2% |
| U.S. large-cap | 5.4%–7.4% | 6.4% | VV | 18.5% | -4.5% | 5.2% |
| U.S. small-cap | 6.2%–8.2% | 7.2% | VB | 15.6% | -0.6% | 6.8% |
| U.S. REITs | 4.1%–6.1% | 5.1% | VNQ | 9.4% | 1.0% | 4.0% |
| Foreign stocks (unhedged) | 8.5%–10.5% | 9.5% | VXUS | 11.5% | 7.5% | 7.2% |
| U.S. aggregate bonds | 0.9%–1.9% | 1.4% | BND | -0.2% | 3.0% | 4.5% |
| U.S. Treasury bonds | 0.4%–1.4% | 0.9% | VGIT | -1.0% | 2.8% | 4.3% |
| U.S. credit bonds | 1.8%–2.8% | 2.3% | VTC | 1.2% | 3.4% | 4.5% |
| U.S. high-yield corp. bonds | 4.8%–5.8% | 5.3% | VWEHX | 6.0% | 4.6% | 5.4% |
| U.S. TIPS | 0.2%–1.2% | 0.7% | VAIPX | 2.2% | -0.8% | 3.4% |
| U.S. cash | 0.6%–1.6% | 1.1% | VUSXX | 2.6% | -0.4% | 3.6% |
| Foreign bonds (hedged) | 0.7%–1.7% | 1.2% | BNDX | 0.2% | 2.2% | 4.8% |
| Inflation | 0.5%–1.5% | 1.0% | CPI | 4.4% | -2.3% | 2.1% |
In the final column of the table, I included the midpoint of Vanguard’s most recent predictions. Today’s 10-year forecasts are much rosier than the implied five-year returns from the 2020 forecast.
This brings us to the real question: Do Vanguard's predictions have any utility, or are they just marketing?
Our Portfolios
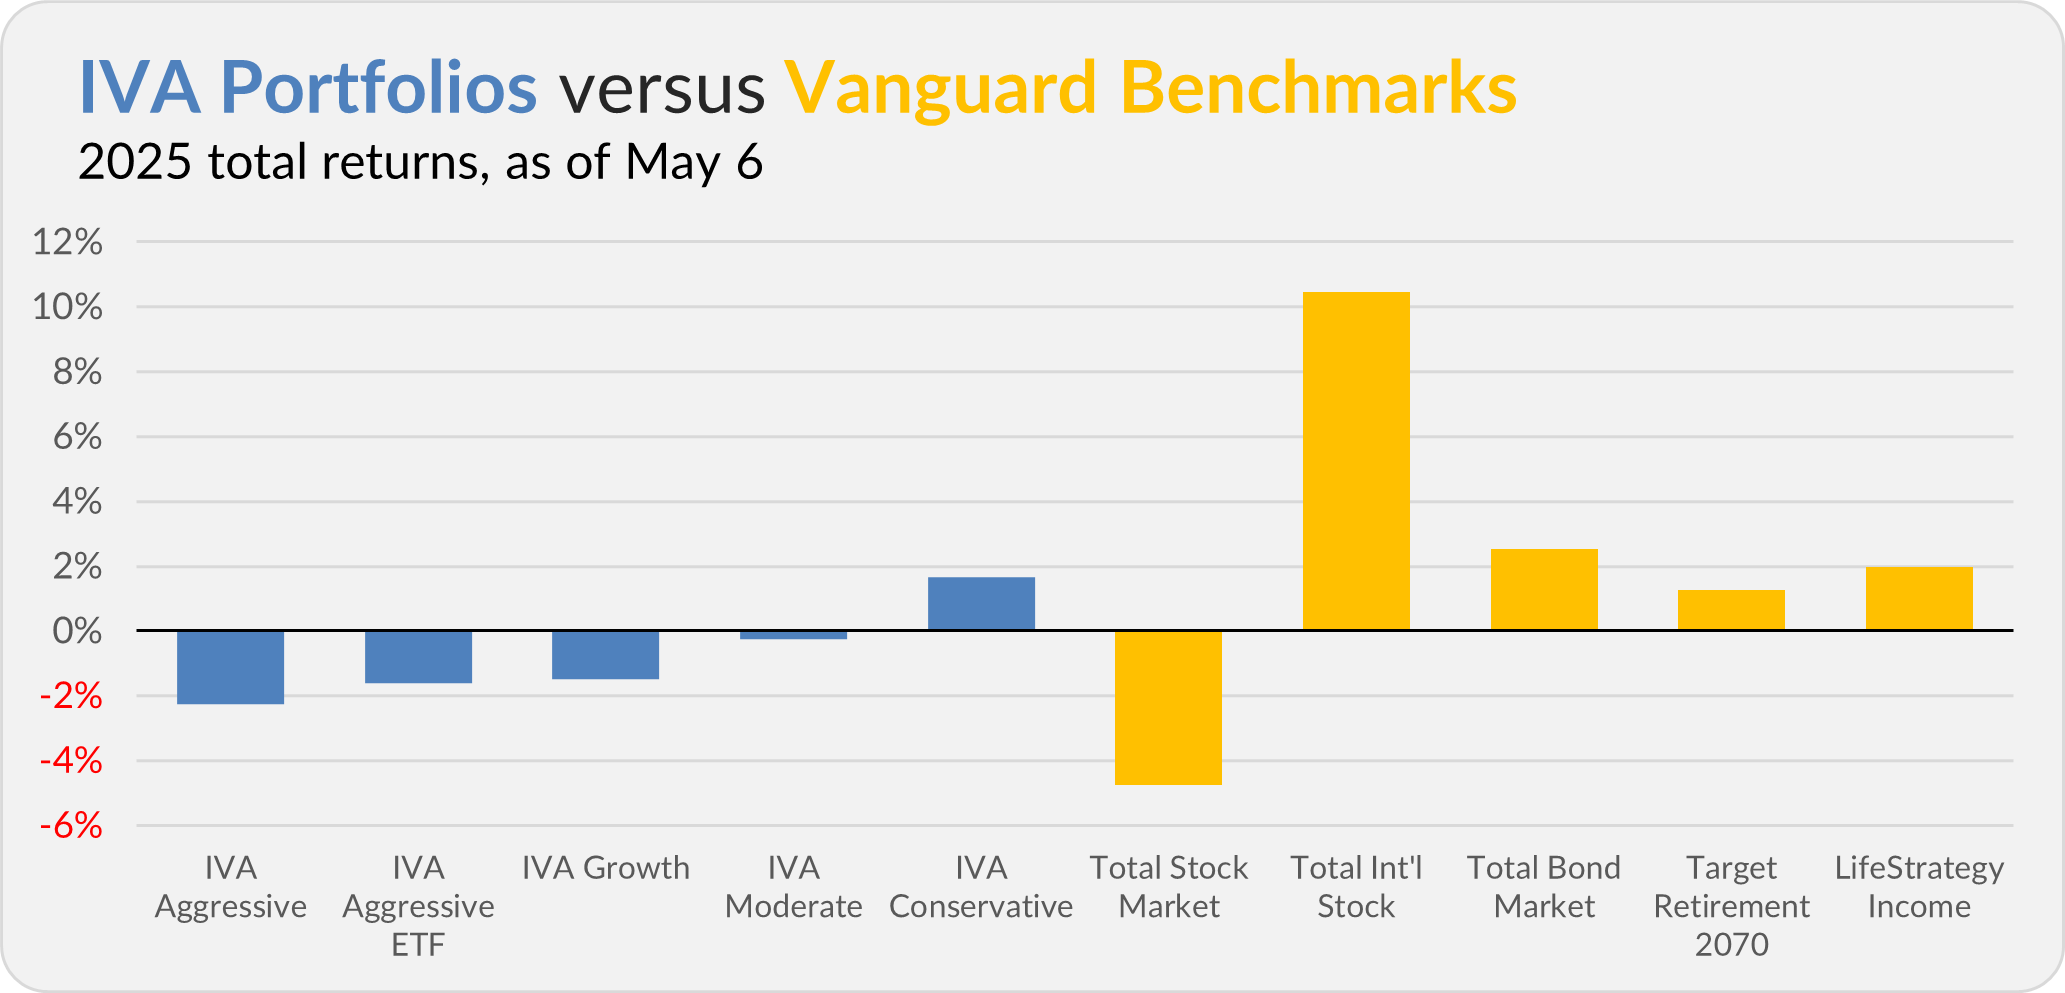
Our Portfolios are showing mixed returns for the year through Tuesday. The Aggressive Portfolio is off 2.3%, the Aggressive ETF Portfolio is down 1.6%, the Growth Portfolio has declined 1.5%, the Moderate Portfolio is off 0.3% and the Conservative Portfolio is up 1.7%.
This compares to a 4.8% decline for Total Stock Market Index (VTSAX), a 10.5% return for Total International Stock Index (VTIAX), and a 2.5% gain for Total Bond Market Index (VBTLX). Vanguard’s most aggressive multi-index fund, Target Retirement 2070 (VSNVX), is up 1.3% for the year, and its most conservative, LifeStrategy Income (VASIX), is up 2.0%.
IVA Research
Yesterday, I continued my exploration of after-tax returns by trying to answer a simple question: Can actively managed funds outperform after taxes? Premium Members can read my analysis here.
Until my next IVA Weekly Brief, have a safe, sound and prosperous investment future.
Still waiting to become a Premium Member? Want to hear from us more often, go deeper into Vanguard, get our take on individual Vanguard funds, access our Portfolios and Trade Alerts, and more? Start a free 30-day trial now.
Data sources for the Bessent table:
Civilian workforce, total employed: Civilian Labor Force Level (CLF16OV) | FRED | St. Louis Fed
Unemployment rate: Unemployment Rate (UNRATE) | FRED | St. Louis Fed
ISM Manufacturing PMI: US ISM Manufacturing PMI Monthly Trends: ISM Manufacturing Report On Business | YCharts
Industrial Production Manufacturing Index: Industrial Production: Manufacturing (SIC) (IPMANSICS) | FRED | St. Louis Fed
Manufacturers’ New Orders: Manufacturers' New Orders: Durable Goods (DGORDER) | FRED | St. Louis Fed
Real GDP: Real Gross Domestic Product (GDPC1) | FRED | St. Louis Fed
Average hourly earnings: Average Hourly Earnings of All Employees, Total Private (CES0500000003) | FRED | St. Louis Fed
Wages and salaries: Compensation of Employees, Received: Wage and Salary Disbursements (A576RC1) | FRED | St. Louis Fed
WTI crude oil: CL1 - Koyfin
National debt: Understanding the National Debt | U.S. Treasury Fiscal Data
Total debt as % of GDP: Federal Debt: Total Public Debt as Percent of Gross Domestic Product (GFDEGDQ188S) | FRED | St. Louis Fed
U.S. Imports of Goods From China: U.S. Imports of Goods by Customs Basis from China (IMPCH) | FRED | St. Louis Fed
ICE US Dollar index: ICE US Dollar Index Performance & Stats
Vanguard and The Vanguard Group are service marks of The Vanguard Group, Inc. Tiny Jumbos, LLC is not affiliated in any way with The Vanguard Group and receives no compensation from The Vanguard Group, Inc.
While the information provided is sourced from sources believed to be reliable, its accuracy and completeness cannot be guaranteed. Additionally, the publication is not responsible for the future investment performance of any securities or strategies discussed. This newsletter is intended for general informational purposes only and does not constitute personalized investment advice for any subscriber or specific portfolio. Subscribers are encouraged to review the full disclaimer here.