Welcome to my cash management series’ fourth (and final) article. If you are just joining us or want to revisit one of the topics I’ve covered, here are the prior three installments:
- Van-guarding Your Cash: My take on Vanguard’s money market funds and new cash sweep programs.
- When Cash Isn’t Cash: My analysis of Vanguard’s cash options for annuity holders and 529 plan investors.
- Managing Your Cash: My framework for building your personal cash management program.
Hopefully, I was clear last week in saying that I consider “cash management” distinct from managing my long-term investment portfolio. I have long viewed cash as a financial management tool, not an investment. Today, I’m going to put that to the test by asking the question: Does cash belong in your investment portfolio?
And please, let’s put aside the idea of using cash to time the market—whether you’re thinking of stocks, bonds or some other financial asset. I know holding cash can look brilliant (or dumb) in the short run, depending on the timing. But I’m interested in whether cash can be used as a long-term portfolio holding—think 10-plus years.
Key Points
- Investors have been well-rewarded for taking on risk over time: Stocks have beaten bonds, and bonds have outpaced cash.
- However, cash has also matched bond returns over long periods—for example, from 1939 through 1979—and provided better downside protection against stock market declines.
- Bonds are unlikely to outperform cash by the margins they did from 1980 through 2020.
The Theory
A basic premise of investing is that you need to take risks to earn a return—and the more risk you take, the greater your potential profit (or loss).
Well, money market funds, with their stable NAVs, have essentially no risk—and Vanguard’s are some of the safest you’ll find. So, should we expect much of a return on our cash if it’s sitting in a money market fund?
Said differently, stocks are riskier than bonds, and bonds are riskier than cash. Ergo, stocks should beat bonds, which should, in turn, beat cash.
If that’s the case, long-term investors looking to grow their wealth should invest as much as they are comfortable with in stocks, and then look to bonds to manage their risk. Cash should be the final and smallest allocation in a long-term investment portfolio—and maybe shouldn’t be considered at all.
That’s the theory, anyway. Let’s see if history backs it up.
The Long View
To put the theory to the test, I turned to four data sources with returns stretching back to the late 1800s and early 1900s. (For details on and links to the sources, see the appendix.)
Fair warning: I’m pretty skeptical of data going back to the early 20th century and earlier. Economic and market structures were very different in the early 1900s compared to today. For instance, you couldn’t buy the market through a low-cost index fund like you can today. In fact, it was tough to buy any securities, and the costs of brokerage were substantial. Raw numbers are deceptive at best; I could go on.
My skepticism is, in part, why I consider multiple sources. Fortunately, all four sources report substantially similar figures, lending some confidence to my analysis. (Or it could be an indication that they are all feeding from the same trough.)
Nonetheless, looking at 100-plus years of data can form the foundation of our understanding of how stocks, bonds and cash perform over time.
The chart below shows the annualized total returns adjusted for inflation (called a real return) for stocks, bonds and cash. For U.S. assets, I averaged the returns reported by the four sources. Only one source reported stock, bond and cash returns from foreign markets. I’ve included that to provide additional context.
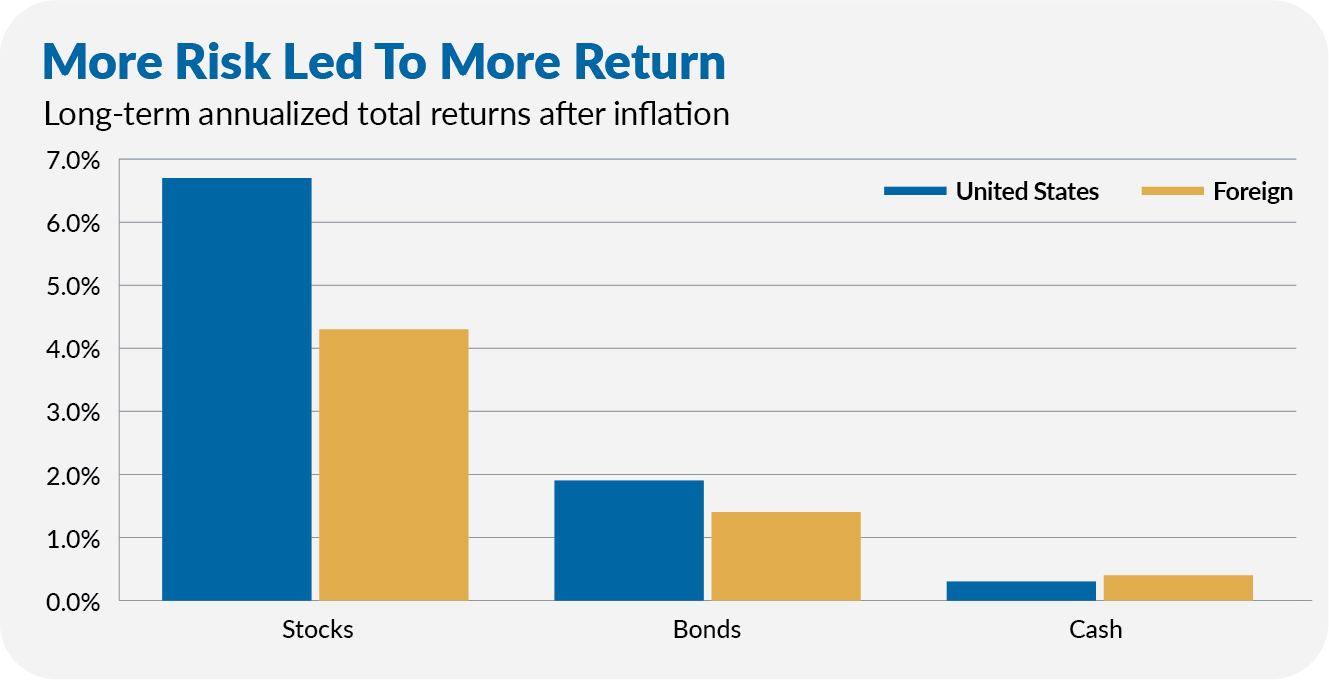
A few things jump out to me.