Hello, this is Jeff DeMaso with the IVA Weekly Brief for Wednesday, February 21.
There are no changes recommended for any of our Portfolios.
Back to the Future
The lost decade—or rather the THREE lost decades in Japan’s stock market is nearly over.
Japan’s S&P 500ish index, the Nikkei 225, closed at 38188.85 on Tuesday. That’s just 1.9% shy of the index’s prior high of 38915.87 reached on December 29, 1989. Yes, that’s 1989. Japan’s market has been underwater, in one sense, for more than 34 years.
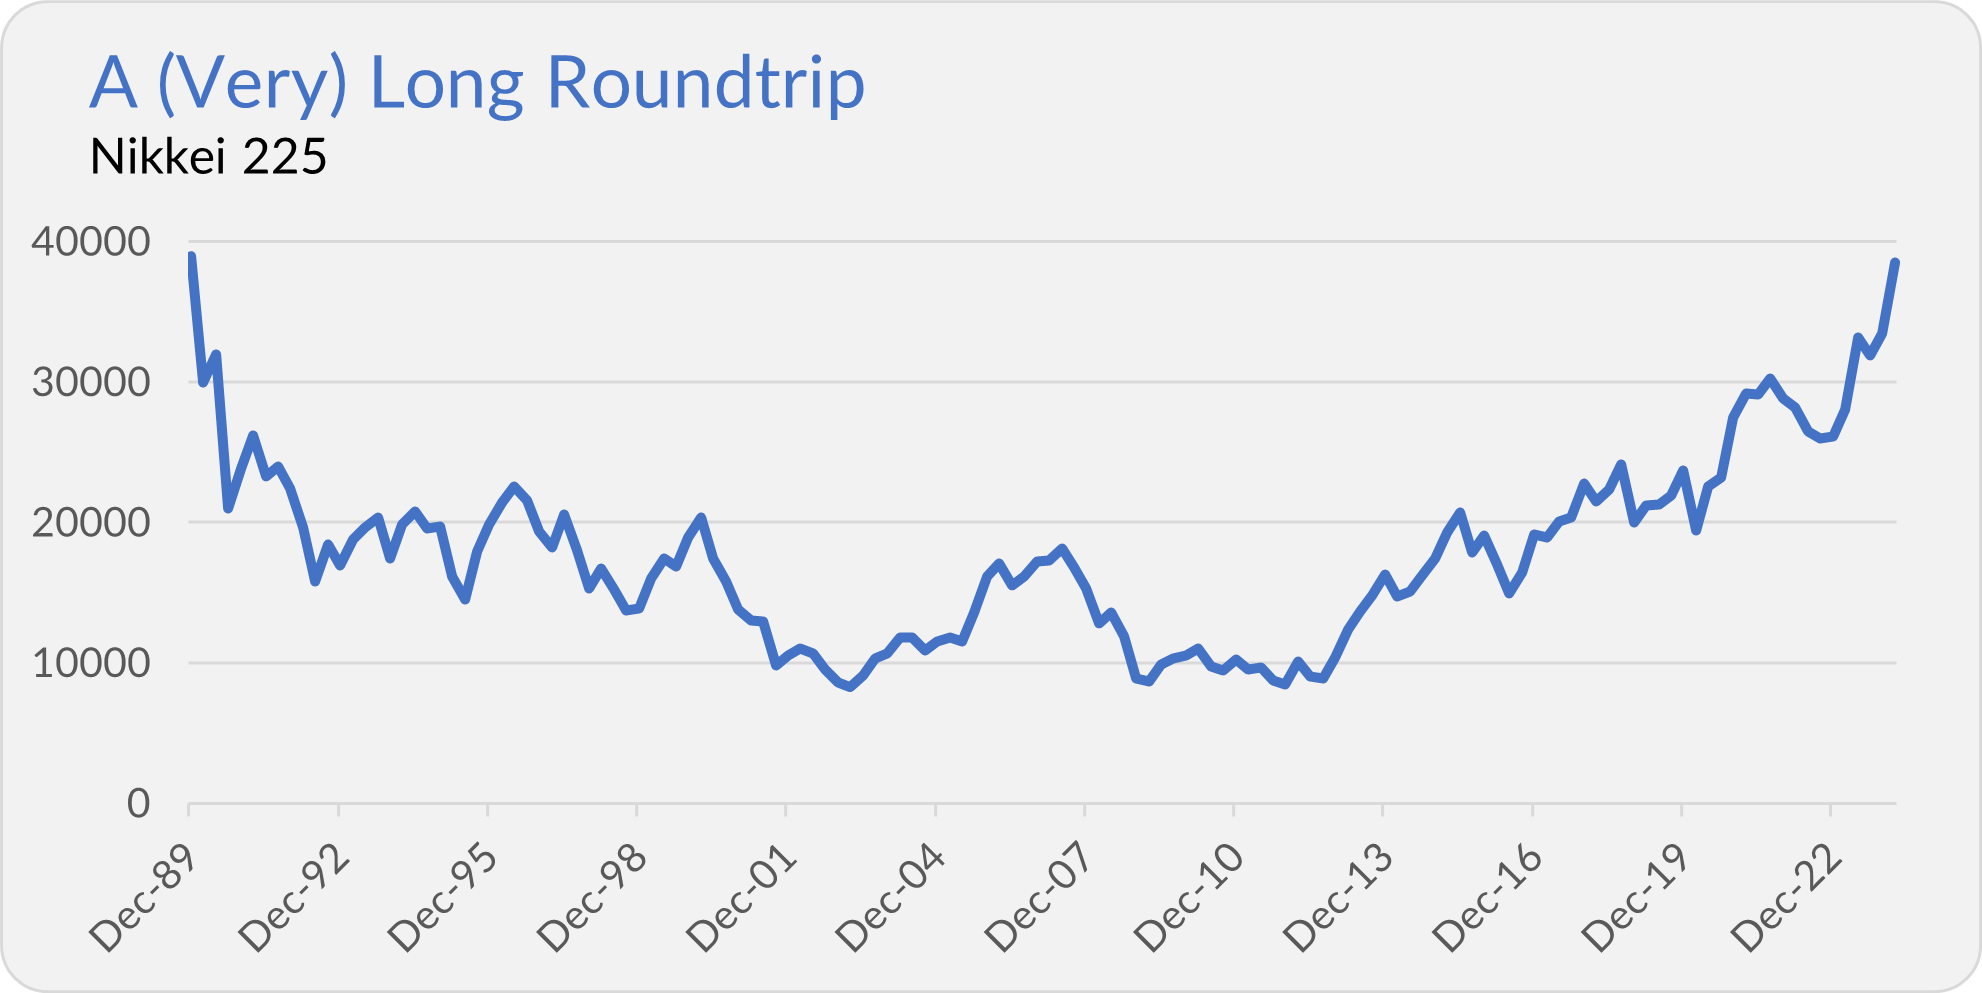
You will see many charts in the media, like the one below, showing the path of the Nikkei 225 since the end of December 1989.
Or maybe you’ll see it presented as a drawdown chart like the one below.
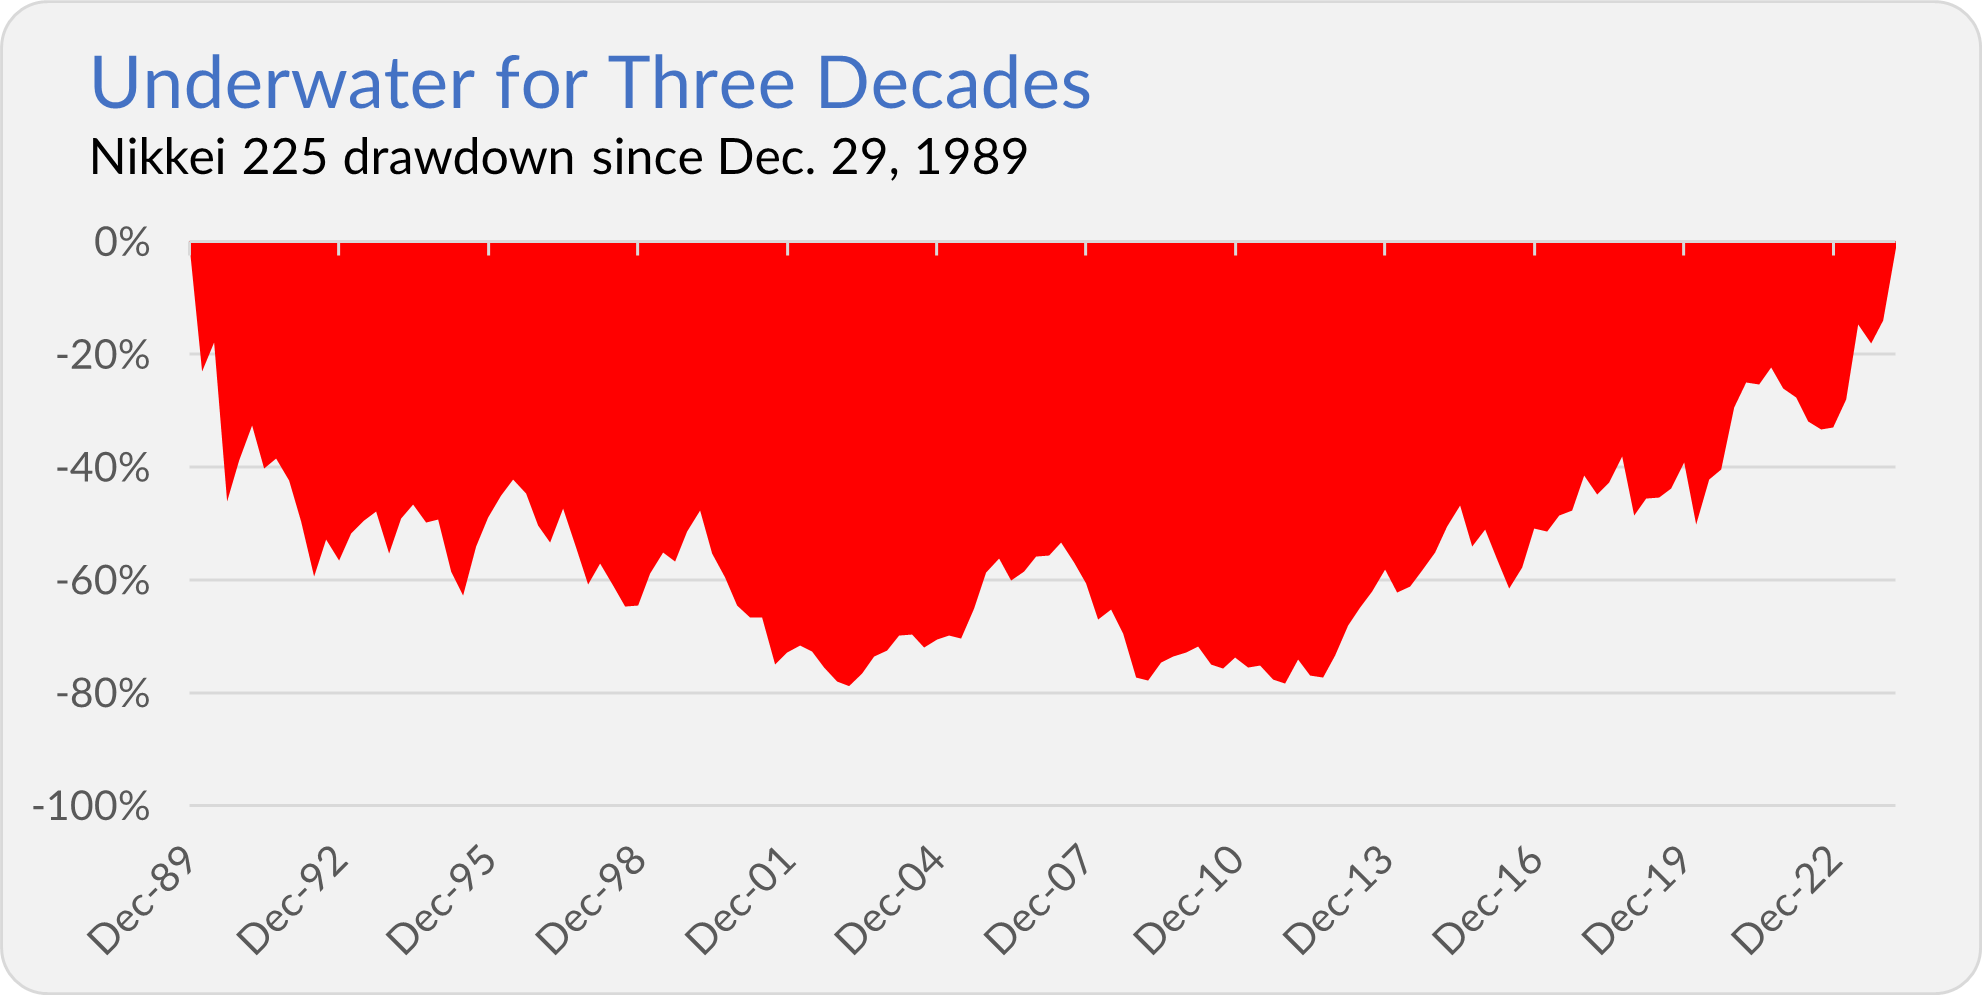
Both charts tell the same story. The Nikkei peaked in 1989, fell 80% (the low point was hit in March 2009) and then recovered over the past decade. That’s over three decades of going effectively nowhere. (Ouch!) The S&P 500 index, by comparison, returned about 1,300% (or 8% per year) over this run.
Some investors consider these charts “Exhibit A” for why you shouldn’t own foreign stocks. But I take the opposite view: They are precisely why you don’t want to put all your eggs in any one market basket.
Let me provide more context.
The following chart tracks the growth of the Nikkei 225 and the S&P 500 indexes from the U.S. index’s 1957 inception. I used annual data and put the S&P 500 index on equal footing with the Nikkei in 1957 so we can compare apples-to-apples.
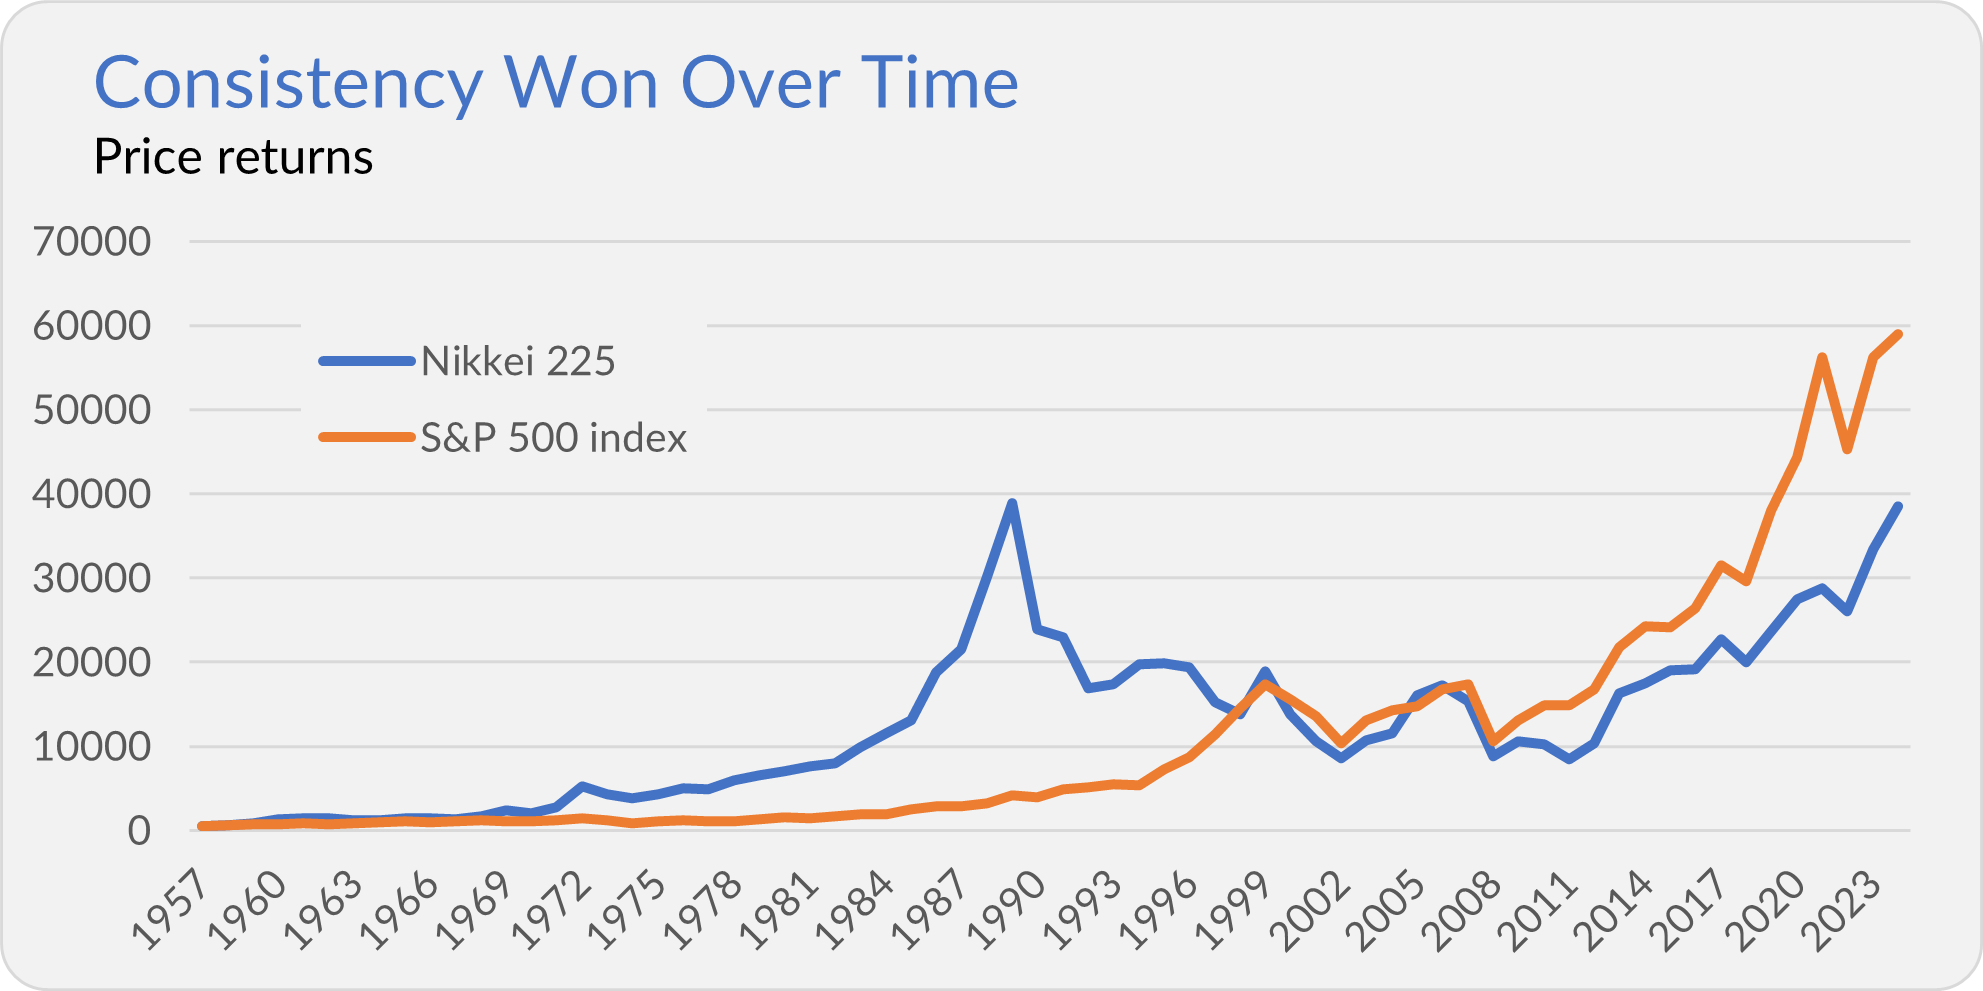
As you can see, Japan’s market left the U.S. market in the dust between 1957 and 1989. The Nikkei grew 8,153% (or nearly 15% per year) while the S&P 500 “only” advanced 784% (or 7% per year).
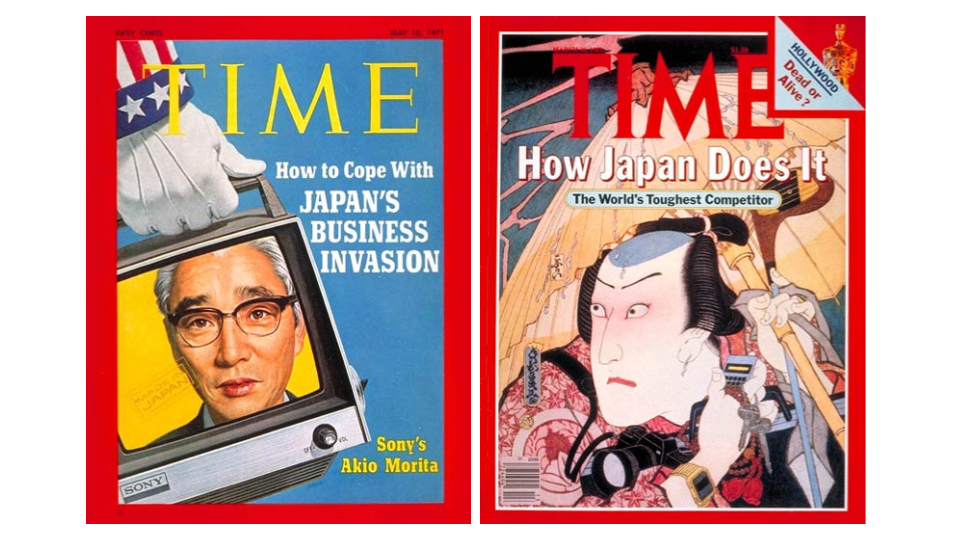
In the 1980s, everyone “knew” that Japanese companies were taking over the business world. Even in the 1970s, U.S. companies struggled to cope with Japanese competition. For example, consider the two TIME magazine covers from the 1970s and 1980s below.
However, with the benefit of hindsight, we know that in 1989, the Japanese stock market was a massive bubble about to pop. And, as I said, while the Nikkei went roundtrip over 34 years, the S&P 500 went up over 1,300% (or 8% per year).
Let’s bring this back to Vanguard. You won’t find a “Japan” index fund at Vanguard. The closest thing is Pacific Index (VPADX), which launched in May 1990 and has about 60% of its assets in Japanese stocks. That wasn’t the exact peak of the Japanese stock market, but Vanguard’s timing couldn’t have been much worse.
The chart below tracks the cumulative returns of investments made in 500 Index (VFIAX), Pacific Index and European Index (VEUSX) since the foreign stock index funds’ inception. As you can see, 500 Index outperformed the regional, foreign index funds by a very wide margin.
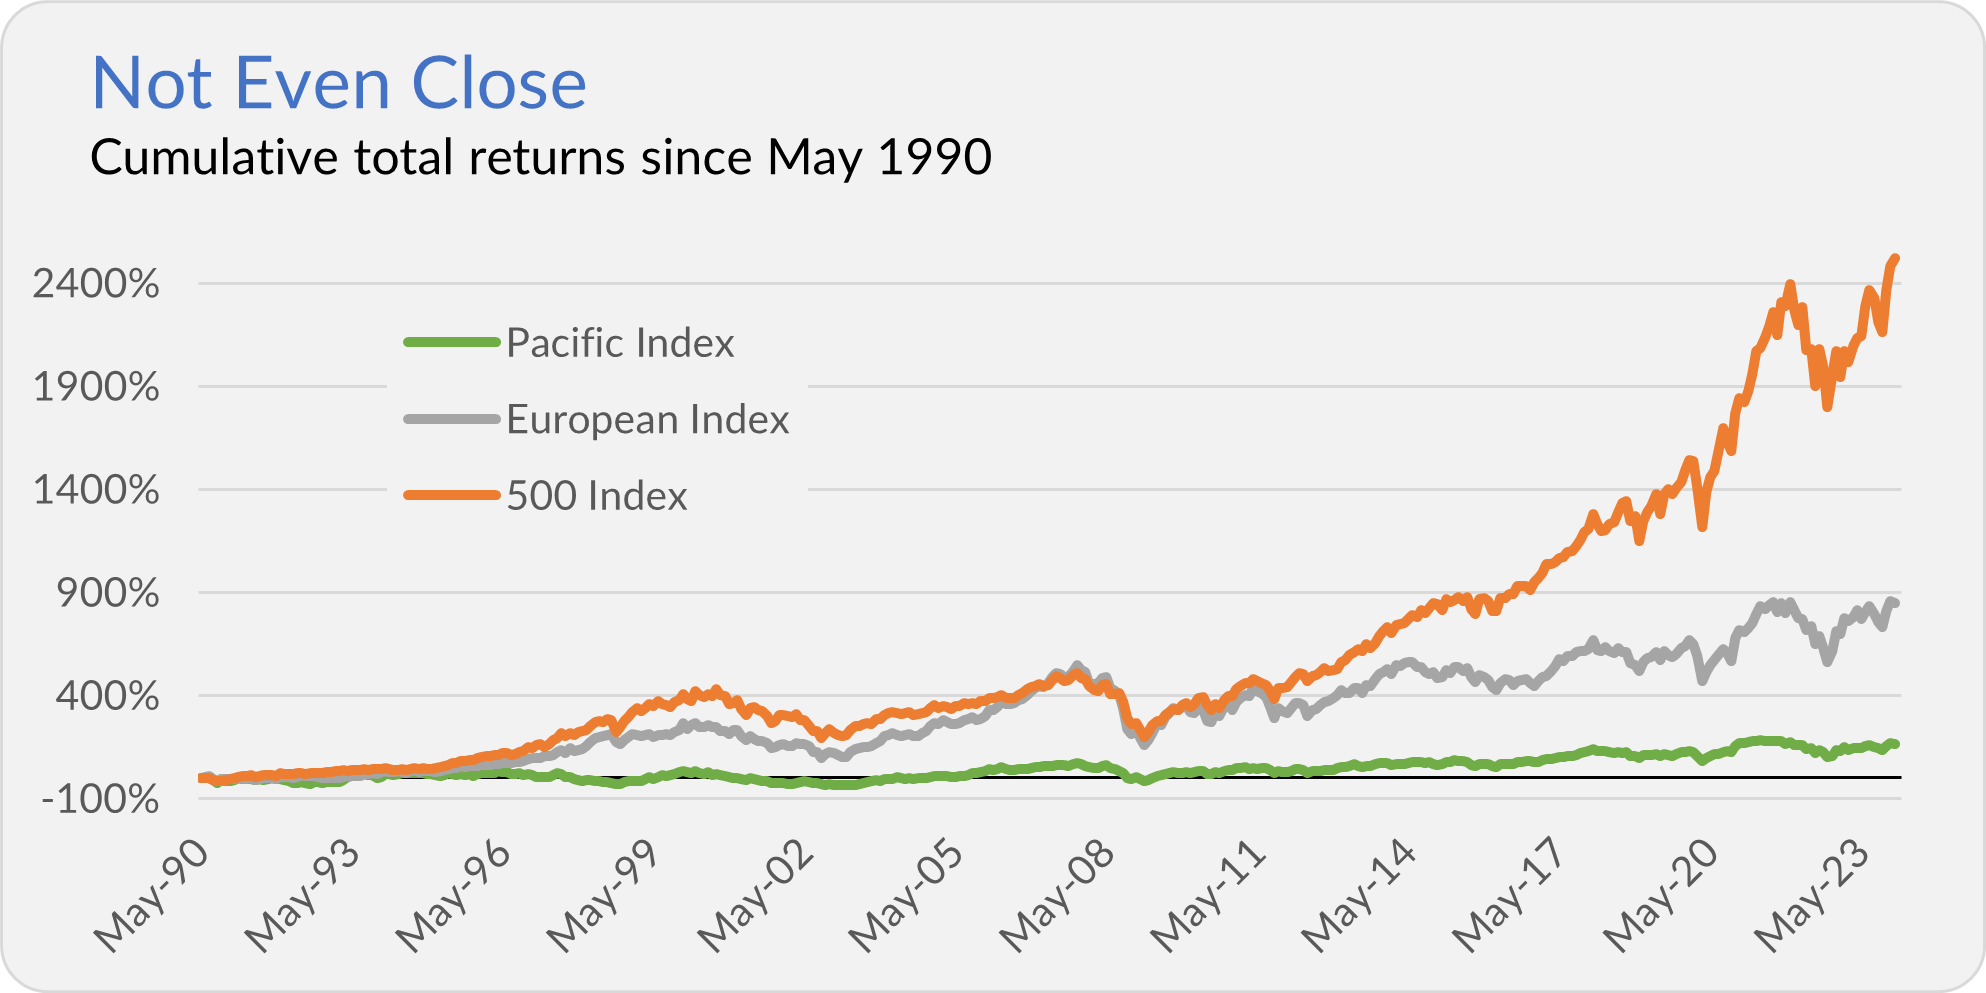
To put some numbers on it. As of the end of January, 500 Index was up 2,524% (10% per year), European Index was up 847% (7% annually) and Pacific Index was up 164% (3% per year).
It’s tempting to look at the last three decades and conclude that you only need to own U.S. stocks. However, keep in mind that an investor in 1989 might come to the same conclusion … about Japanese stocks.
To be clear, I am not saying the U.S. stock market is in a bubble on par with what we saw in Japan in the 1980s. I’m also not saying the U.S. market is about to endure three decades of no growth.
But this is why I want my portfolio to be diversified across the globe—it protects against the risk, however small, of a deeply adverse experience in U.S. markets.
Premium members who want to dive deeper into the merits of owning a globally diversified portfolio can continue here. If that’s you, you might also like this article digging into the performance of the different regions over time.
Amazon, Welcome to the Dow
I described the Nikkei 225 as “Japan’s S&P 500ish” index. But I really should have called it Japan’s Dow index.
The Nikkei, like the Dow, averages stock prices. So, stocks with higher prices have larger weights in the index. This differs from most indexes (including the S&P 500 index), which consider the company's size (price and number of shares outstanding) in its construction. The bigger the company’s market capitalization (size), the larger its weight in the index.
Constructing an index using stock prices is simple, which counted for a lot when the Nikkei (1950) and Dow (1896) were created. But using stock prices instead of size leads to some funky results (to use a technical term).
For example, Fast Retailing (owner of fashion company Uniqlo) is the largest position in the Nikkei at about 11% of the index. The largest holding in the Dow? It’s United Health at a 9% position.
While the Nikkei is making headlines for nearing a new high for the first time in decades, the Dow is also in the news. Amazon will join the Dow on Monday as Walgreens is given the boot.
Walgreens was only added to the Dow in June 2018. It makes you wonder why Amazon didn’t make the cut six years ago.
The Dow has a long (long) history and is quoted in the media; for those reasons, I speak to it from time to time. But it’s an odd index of just 30 stocks that gives the higher priced stocks, not larger stocks, bigger positions. Heck, it hasn’t included Amazon yet! For those reasons, I don’t pay the Dow too much attention.
Our Portfolios
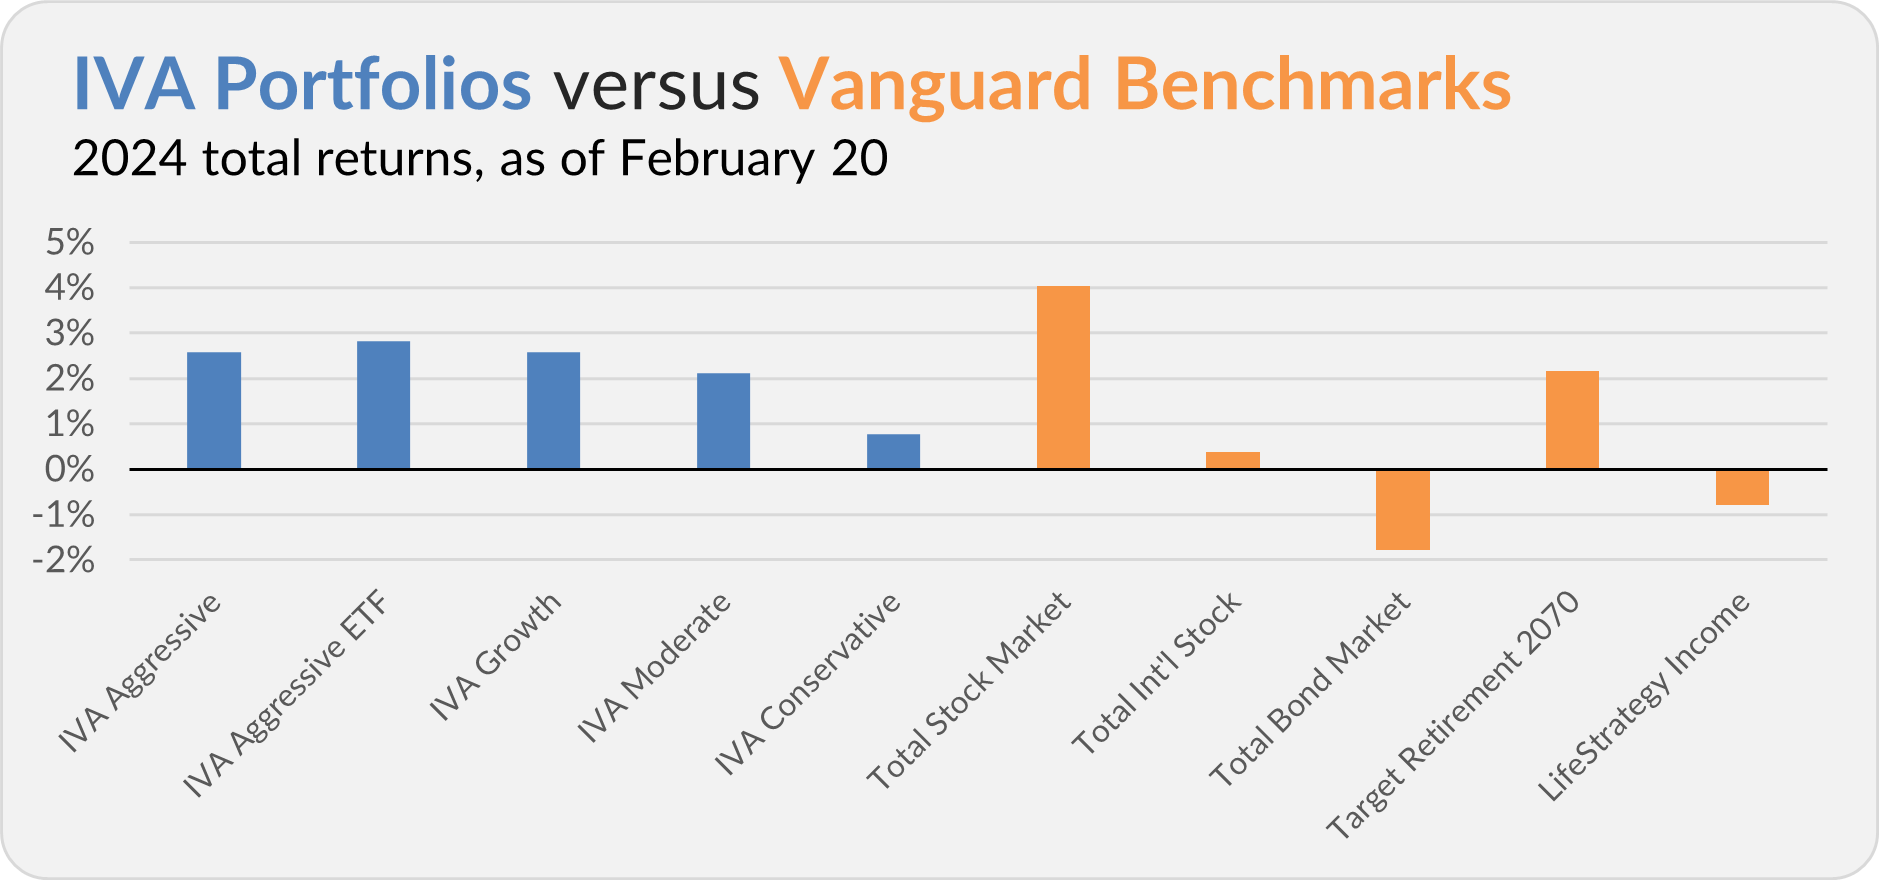
Our Portfolios are showing decent returns for the year through Tuesday. The Aggressive and Growth Portfolios are up 2.6%, the Aggressive ETF Portfolio is up 2.8%, the Moderate Portfolio is up 1.5% and the Conservative Portfolio is up 0.4%.
This compares to a 4.0% gain for Total Stock Market Index (VTSAX), a 0.4% return for Total International Stock Index (VTIAX), and a 1.8% decline for Total Bond Market Index (VBTLX). Vanguard’s most aggressive multi-index fund, Target Retirement 2070 (VSNVX), is up 2.2% for the year, and its most conservative, LifeStrategy Income (VASIX), is down 0.8%.
IVA Research
Yesterday, in When Cash Isn’t Cash, I shared my analysis of cash options for Vanguard annuity holders and 529 plan investors with Premium Members.
Allow me to clarify a statement I made in yesterday’s article. I said,
You can also use money in a 529 plan to pay for private K-12 school tuition, but most of us use them with an eye toward college.
I should have qualified that statement. While the Tax Cuts and Jobs Act (of 2017) allows families to withdraw up to $10,000 per year tax-free from a 529 plan to cover K-12 tuition, not every state has conformed to the new law.
In particular, California, Colorado, Illinois, Michigan, Minnesota, Nebraska, New York and Oregon do not consider K-12 tuition a “qualifying expense.”
I apologize for any confusion. I’ll cover Vanguard’s 529 Plan in greater depth and detail in a future article. Stay tuned.
Until my next IVA Weekly Brief, this is Jeff DeMaso wishing you a safe, sound and prosperous investment future.
Still waiting to become a Premium Member? Want to hear from us more often, go deeper into Vanguard, get our take on individual Vanguard funds, access our Portfolios and Trade Alerts, and more? Start a free 30-day trial now.