Hello, this is Jeff DeMaso with the IVA Weekly Brief for Wednesday, February 15th.
There are no changes recommended for any of our Portfolios.
What’s my quick market commentary given that we’re only 6 weeks into the new year? Growth is beating value, but the divergence is (much) wider among large caps than small caps. The difference is just over three percentage points between small growth and small value while it’s a much larger 11 percentage points among large stocks.
Chalk this up to a rebound in big tech (and tech related) names. This year, Tesla is up more than 70%, Meta NVIDIA (big chip maker) is up nearly 60%, Meta (nee Facebook) is up over 45% and Apple, Microsoft and Amazon are all up between 10% and 20%.
Retail Sales Bounce ...
The economic data continues to show that we are not in a recession. While the housing market may not have completely turned the corner, recent data on home builder confidence suggests we’re on the way. The construction industry is a creator of jobs and demand for consumer goods and materials. Rising confidence among home builders suggests growth, not recession.
Speaking of consumers, they boosted spending in January despite higher prices (more on that in a moment). Retail sales jumped 3% as you and I bought more stuff (think, vehicles, furniture and clothing) and spent more at restaurants. Outside of the noisy data around the pandemic, that’s the biggest monthly jump in retail sales in two decades.
... and Return to Trend
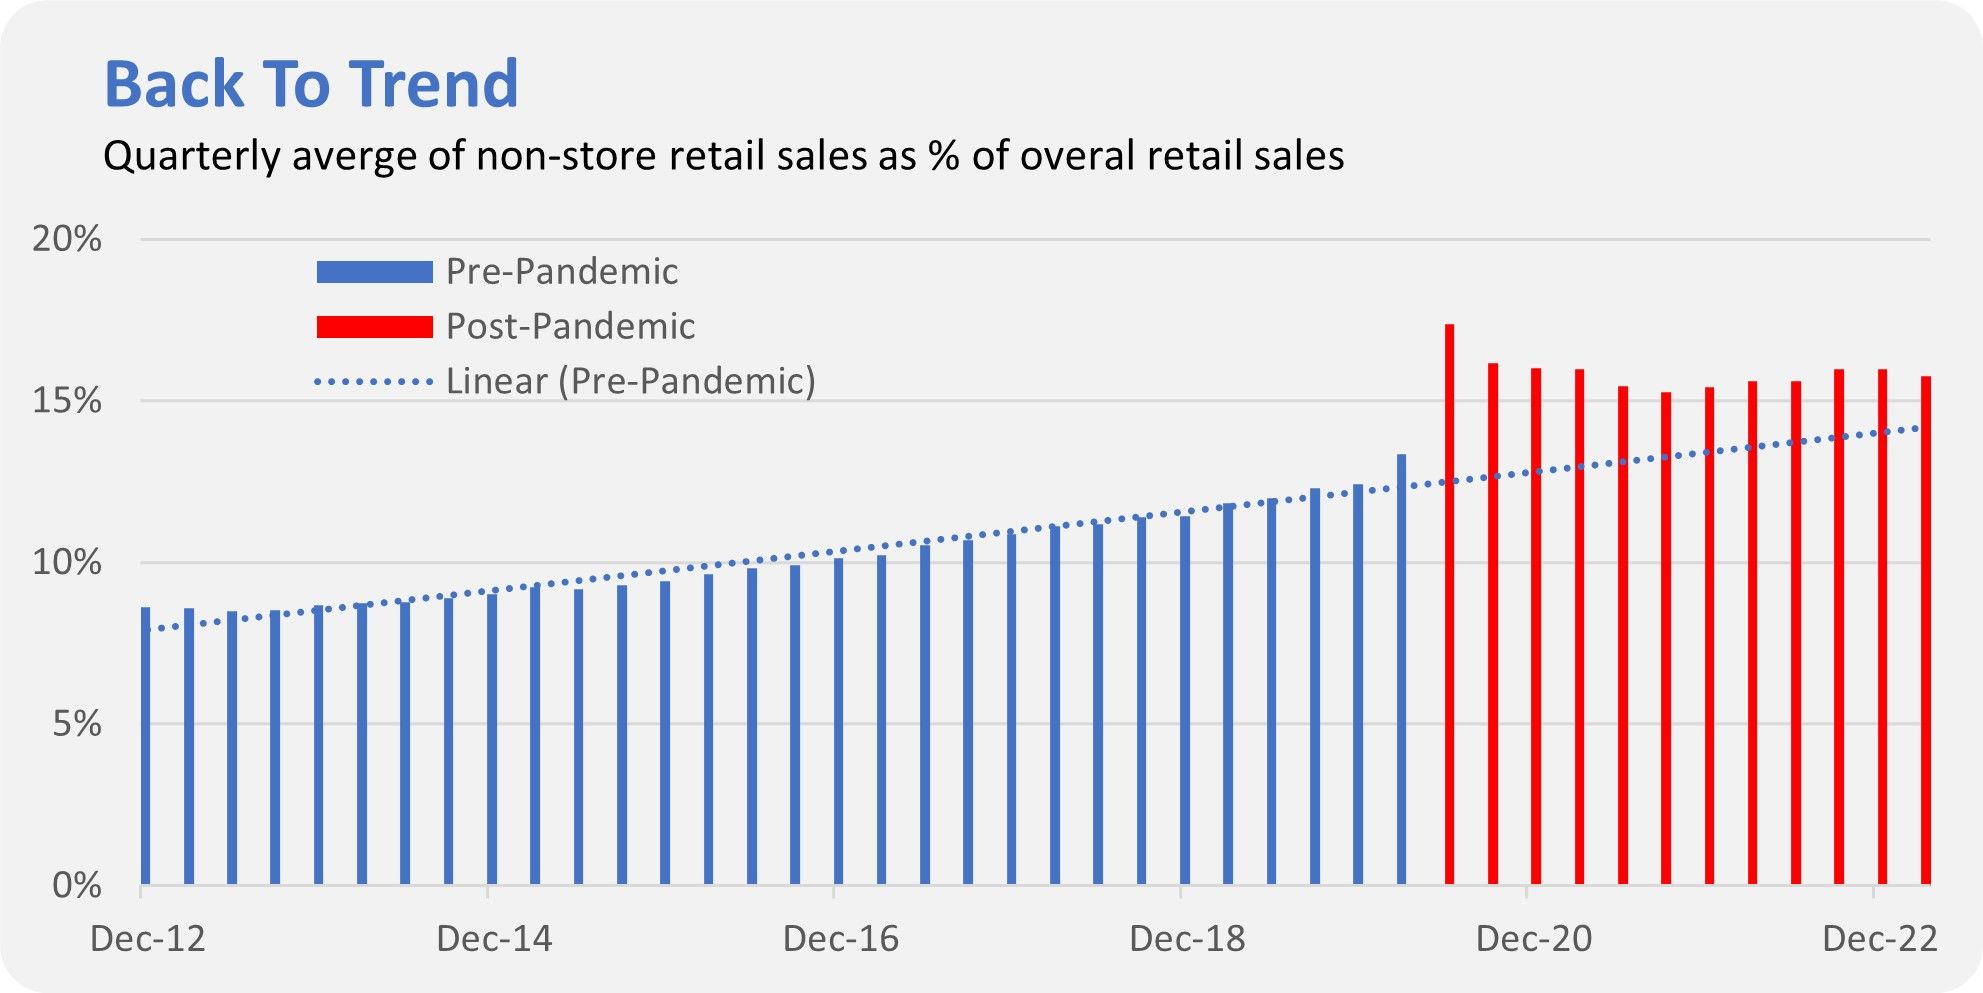
One aspect of retail sales that I keep an eye on is in-store versus non-store spending. The non-store spending category includes more than just online sales—counting things like vending machine sales and door-to-door sales—but I think we can all agree that the rise in non-store spending as a percent of overall retail sales over the past several decades has been driven by e-commerce.
In the chart below, I’ve plotted the percent of retail sales that occurred outside of physical stores over the past decade. I’ve also broken the data out to before and after the pandemic. The dotted line shows what we could’ve expected if the pre-pandemic trend had continued. (Technically, this is a monthly data series and I’m showing the average each quarter. I’ve done this to keep it simple and to show the trend.)
As you’d expect, non-store retail sales jumped from the 12% range before the pandemic to a little over 17% in the second quarter of 2022. The percent of sales happening away from stores fell in the following months and has settled around 16% … which is only slightly more than we’d expect if the pandemic hadn’t happened!
Why do I track this (and share it with you)? After all, spending is spending, regardless of whether it happens in a store or online, right?
In some ways that’s true but this data shows how the economy is evolving and changing. Consider how much malls have suffered—even before the pandemic many malls were struggling—and it’s not like e-commerce has completely taken over as more than 8 out of 10 retail dollars are still spent in stores.
Additionally, it shows how the pandemic “pulled” forward certain trends. It was more or less inevitable that non-store sales would make up 15% of overall retail sales—we just got there a few years sooner due to COVID.
Inflation Check-Up
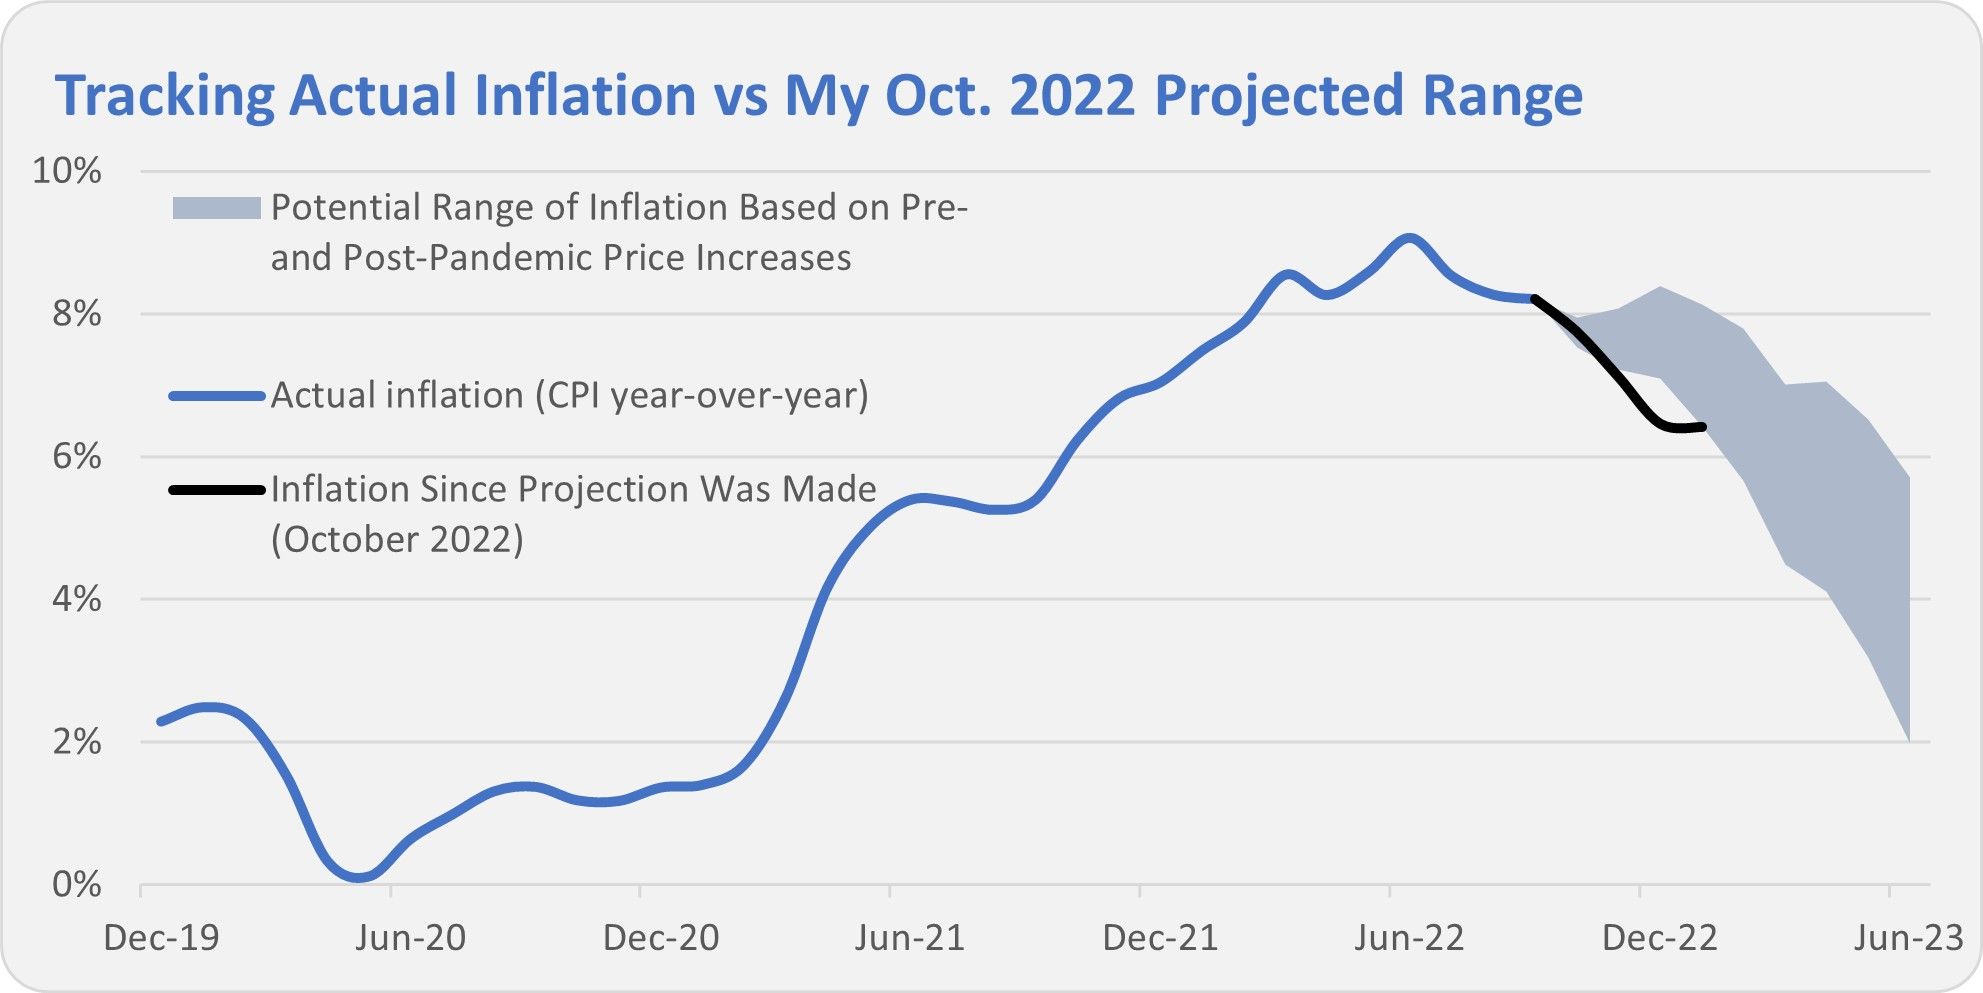
Even though the headline rate fell slightly, prices increased at a faster clip in January than we’ve seen the past few months. Still, inflation continues to track at the lower end of the range I first set out in October. According to the Bureau of Labor Statistics (BLS) consumer prices jumped 0.5% in January and the Consumer Price Index (CPI) is up 6.4% over the past twelve months—down from 6.5% in December.
That’s clearly higher than the Federal Reserve’s target of 2% inflation but I also never expected we’d get anywhere near that 2% level this early in the year—if we even get there at all.
For what it’s worth, since I laid out my inflation range, prices have been increasing at a 2.4% annual pace. If that holds for the next four months, we can expect inflation to clock in around 3% in the middle of the year. Time will tell.
Crying Uncle
As I told Premium Members in yesterday’s Quick Take , Vanguard’s inhouse active managers are crying uncle. Vanguard plans to liquidate their “hedge fund” Alternative Strategies (VASFX) in April. Then, in May, they’ll merge Managed Allocation (VPGDX) into LifeStrategy Moderate Growth (VSMGX). Premium Members can read more here but the bottom line is that adding complexity doesn’t guarantee better investment outcomes.
Our Portfolios
Our Portfolios are showing solid absolute but lagging returns for the year through Tuesday. The culprits for our short-term underperformance are Dividend Growth (VDIGX), which is up just 0.2% this year, and Health Care ETF (VHT), which is down 1.4%. International Growth’s (VWIGX) 12.2% return is among the best of Vanguard’s diversified stock funds so far this year, but it hasn’t been enough to make up the difference in our Portfolios.
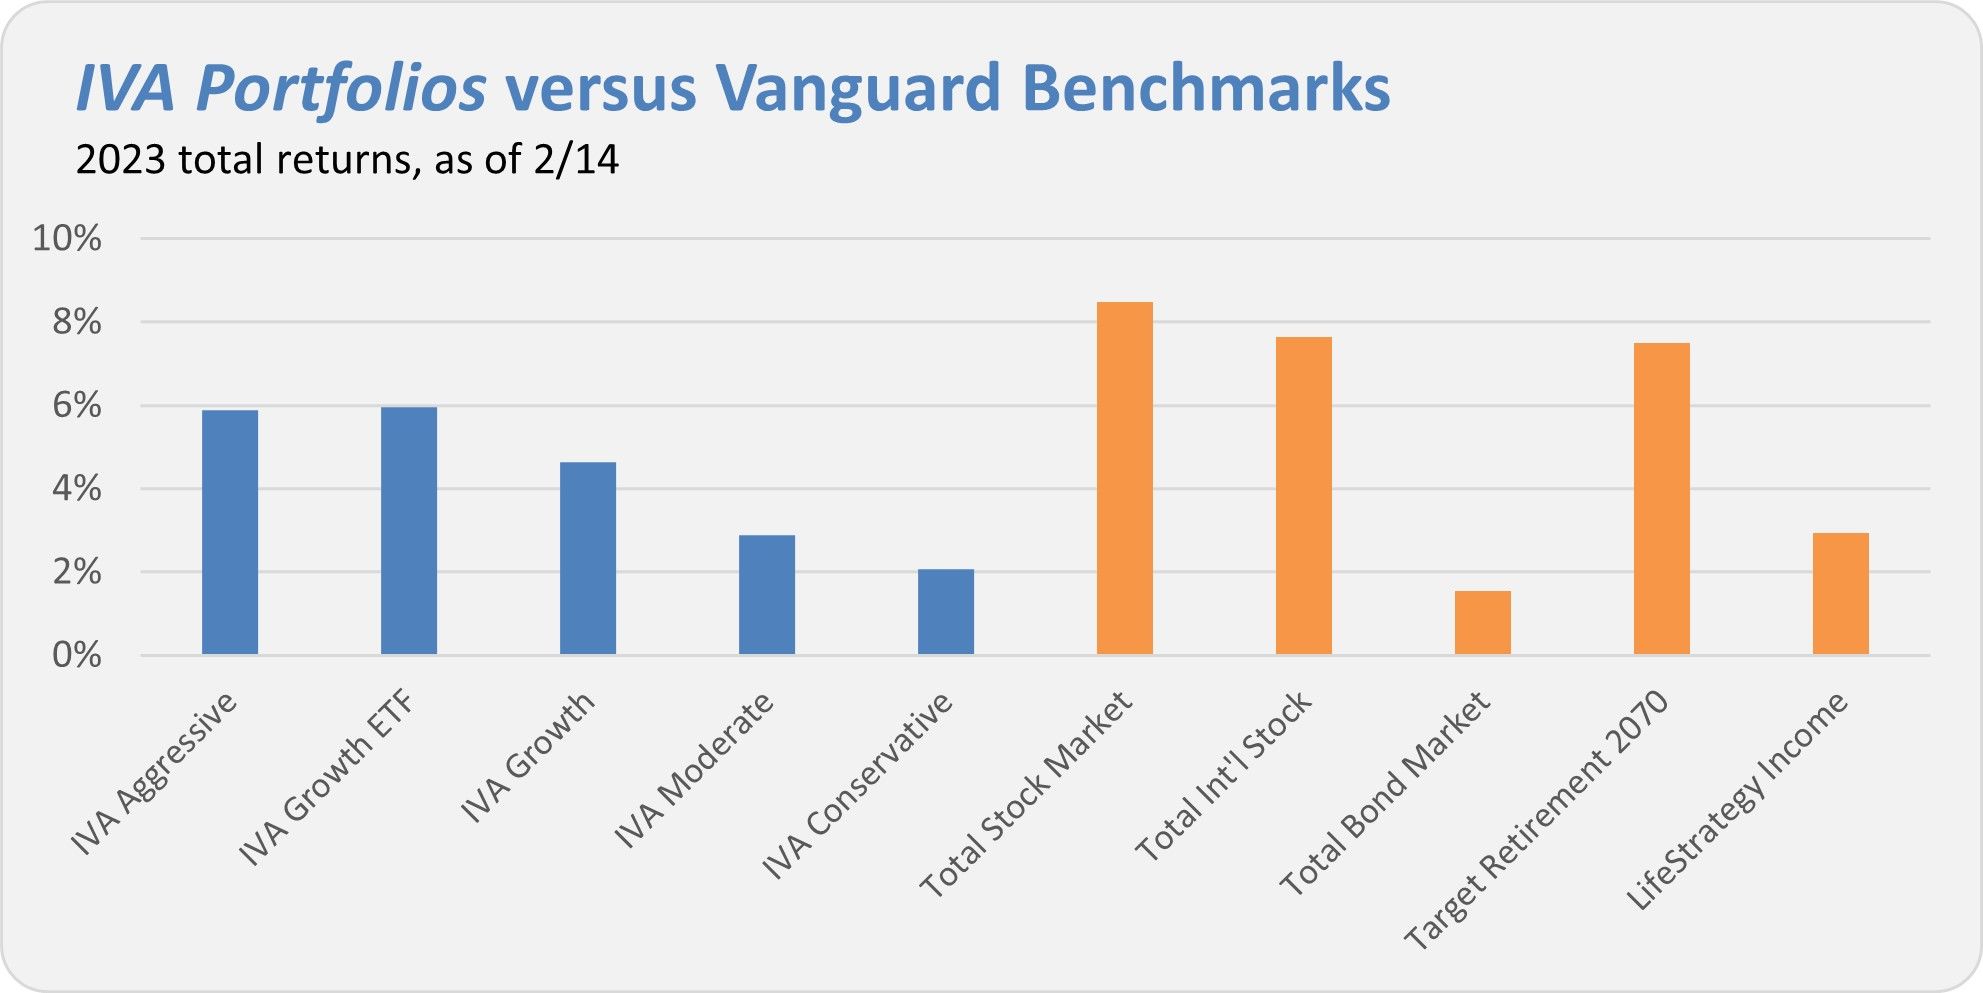
The Aggressive Portfolio is up 5.9%, the Growth ETF Portfolio is 6.0%, the Growth Portfolio has gained 4.6%, the Moderate Portfolio has returned 2.9% and finally the Conservative Portfolio is up 2.1%. This compares to an 8.5% return for Total Stock Market Index (VTSAX), a 7.6% gain for Total International Stock Index (VTIAX), and a 1.5% return for Total Bond Market Index (VBTLX). Vanguard’s most aggressive multi-index fund, Target Retirement 2070 (VSNVX), is up 7.5% for the year and its most conservative, LifeStrategy Income (VASIX), is up 2.9% for the year. With Vanguard planning to merge Managed Allocation out of existence, I’ve dropped the fund from this comparison table.
Until my next Weekly Brief, this is Jeff DeMaso wishing you a safe, sound and prosperous investment future.