Hello, this is Jeff DeMaso with the IVA Weekly Brief for Wednesday, September 6.
There are no changes recommended for any of our Portfolios.
It’s only the third trading day of the month, and Premium Members can read my August market recap here, where, among other things, I try to answer the question, “How will we know if we’ve made a soft landing?”
Today, though, I’m stepping back from the nitty-gritty of economic data.
In particular, I’d like to respond to Mark Hulbert’s MarketWatch article, Don’t expect stocks to beat bonds, which a few subscribers asked me about over the weekend.
For those who can’t access the article, in a nutshell, Hulbert argues that since stocks have beaten bonds by a lot since the pandemic low of March 2020, bonds will beat stocks in the next few years—and not by a small margin.
Hulbert writes, “You have to go back to the 1950s to find another occasion when the S&P 500 over a 41-month period beat intermediate-term Treasurys by more than today’s margin.” He notes that when stocks have beaten bonds by such a wide margin, bonds have, on average, outperformed stocks by 6% a year over the following period.
Hulbert asks us to “[i]magine how terrible it will feel for stocks to lag bonds by 6% not just for one year, but on an annualized basis for the next 3-1/2 years.”
Okay. It’ll feel pretty terrible—I’ll grant him that. But should his analysis have us dumping our stocks to load up on bonds? I’m not convinced.
First, looking at 41 months is oddly specific. But I get it; he’s measuring from the stock market bottom. However, as I like to say, when it comes to investing commentary, you can change the story simply by changing the period you look at.
Second, Hulbert uses data compiled by Yale professor and economist Robert Shiller, which stretches back to the 1870s. I’ve used that data myself from time to time and will use it again. But you should know that it is reconstructed data from a period when the economy and markets differed greatly from today. For example, Treasury bonds were only introduced in the 1930s, and competitive pricing and trading began in the early 1960s.
Using this reconstructed data can lead to a whole host of misleading takeaways. In this case, the Roaring 20s and the Great Depression heavily influenced Hulbert’s conclusion. If you think we’re headed for a Great Depression scenario, then yes, you should probably sell your stocks. Otherwise, keep reading.
As I often do when considering the analysis I read in articles that pique my interest, I try to recreate it using my data and look at it from the view of a “modern Vanguard” investor. The chart below plots the difference in 41-month annualized returns of 500 Index (VFINX) and bonds. To get as much history as possible for “bonds,” I linked up the returns of Long-Term Investment-Grade (VWESX) and Total Bond Market Index (VBMFX).
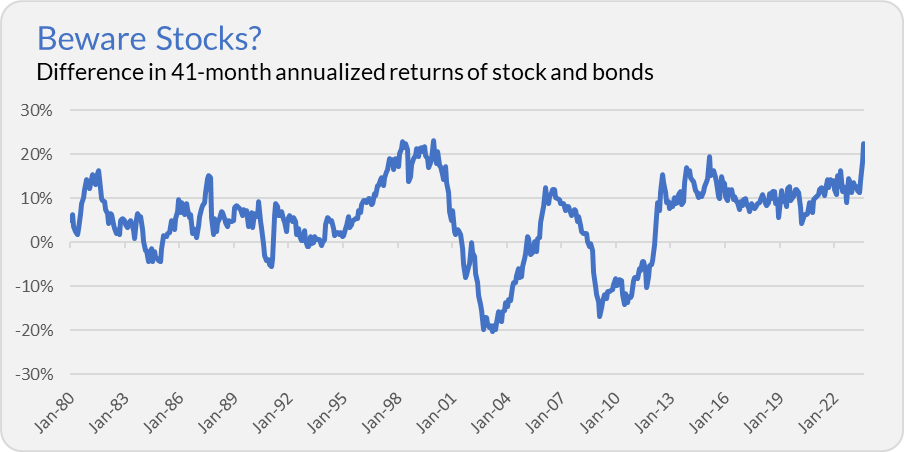
This chart is substantially similar to Hulbert’s. However, my data suggests that the difference between stock and bond returns today was matched during the tech bubble of the late 1990s—much more recent than the 1950s.
And yes, selling stocks in 2000 to buy bonds was the “right” trade for a while. So, you might say that this suggests we should be selling stocks today.
Not so fast. It is instructive to look at both sides of the chart—how stocks and bonds performed over rolling 41-month periods.
Over the past 41 months, 500 Index has compounded at a 19.4% annual rate. That is high—the long-term average is closer to 12% per year—but it’s not extreme either. At the end of the tech bubble, stocks had compounded at 30% a year. (And if you want to go back to the Roaring 20s, stocks also hit 30% annual rates of return.)
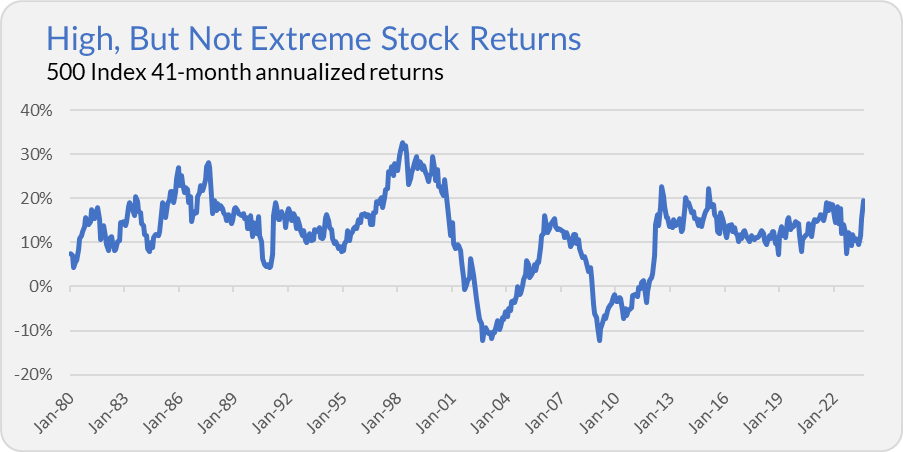
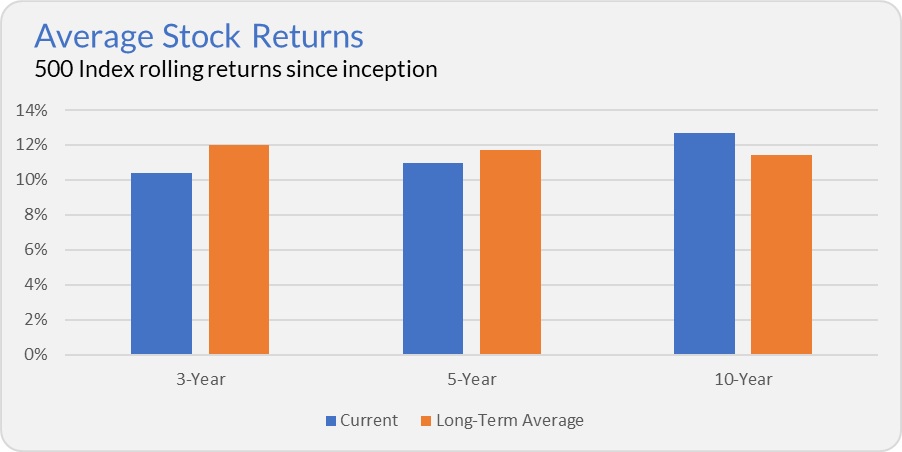
Also, consider that 500 Index is still trading below its January 2022 high. And, if we put aside the specific 41-month period that Hulbert used and instead look at returns over the past three (10.4%), five (11.0%) and ten (12.7%) years, 500 Index’s performance doesn’t look unusual. (Remember what I said about changing the story by changing the time period?)
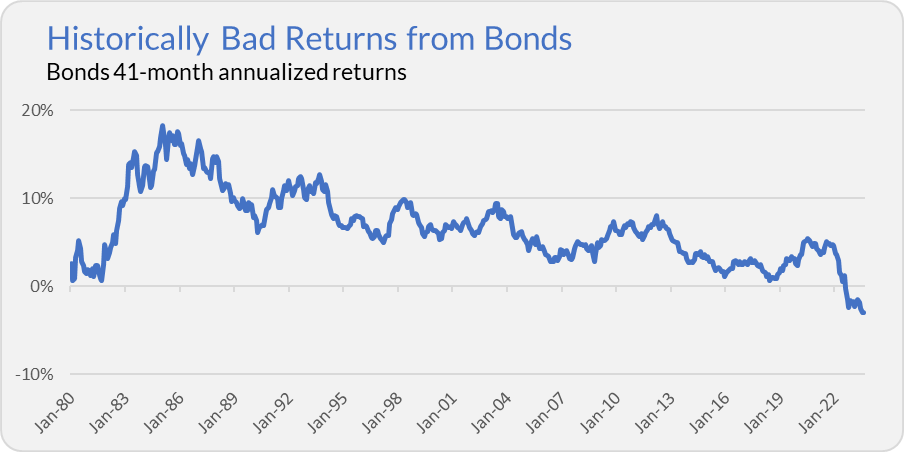
My point is that the dramatic difference in returns between stocks and bonds that has spooked Hulbert hasn’t been driven by rampant stock market gains. Instead, the “culprit” has been historically poor returns from bonds.
Over the past 41 months, bonds have declined at a 3.0% annual rate. As you can see in the chart below, that’s the worst run for bonds since 500 Index’s launch in 1976.
Look. Hulbert isn’t wrong to warn us that markets are cyclical. He’s correct; when markets go to extremes, we often see a “reversion to the mean.”
I agree. We shouldn’t expect stocks to beat bonds by 23% per year over the next 3-1/2 years. I expect both “sides of the equation” will contribute: Bonds will, in all likelihood, do better than -3% per year, and stocks will probably fall short of earning 20% per year.
But does that mean the world Hulbert tells us to imagine—where bonds beat stocks by 6% per year—is guaranteed? Absolutely not.
I don’t write this to take a dig at Hulbert. Subscribers often send me articles like his, asking for my opinion or if they should “take action.”
At the end of the day, I don’t think anyone should upend their portfolio based on one article or one data point. If you did sell your stocks to buy bonds, what happens next? Do you automatically buy stocks after 41 months? What if stocks outperform bonds over the next three to four years? What then?
In my data set, the biggest difference between 41-month annualized stock and bond returns was reached in December 1999—with 500 Index up 29.6% per year and Total Bond Market Index returning 6.4% annually, the difference was 23.2% a year. It would've worked out in the short run if you sold stocks at the end of 1999. But, since December 1999, 500 Index has returned 367% while Total Bond Market Index has gained 138%.
Successful long-term investing is grounded in a philosophy—in a discipline. For me, that’s about spending time in the market, not trying to time the market.
A New Look
I’m excited to say that our redesigned website is up and running.
The website address has not changed. The new site has all the same functionality and features you’ve come to expect but is easier to use. For example, the “Log In” button is more prominent, and there is now a search feature (which will get better with time).
I haven’t spent the billion dollars or so that Vanguard is spending to upgrade its services, but I’m hoping the improvements are to your liking.
Let me know if you run into any issues, and I’ll work to correct them as quickly as possible. And if you have any suggestions for features and improvements, feel free to let me know—I’m constantly exploring ways to make The Independent Vanguard Adviser better and better.
Our Portfolios
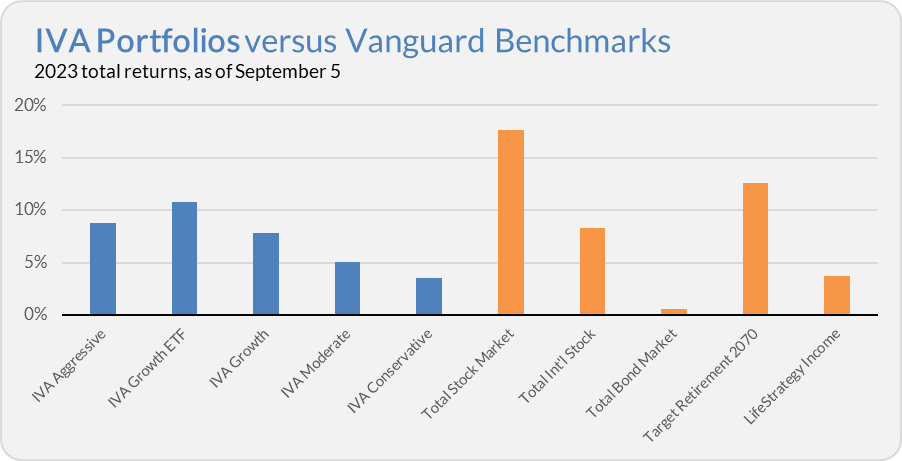
Our Portfolios are showing positive absolute but lagging relative returns for the year through Tuesday. The Aggressive Portfolio is up 8.8%, the Growth ETF Portfolio is up 10.8%, the Growth Portfolio is up 7.8%, the Moderate Portfolio is up 5.1% and the Conservative Portfolio is up 3.5%.
This compares to a 17.7% return for Total Stock Market Index (VTSAX), an 8.3% gain for Total International Stock Index (VTIAX), and a 0.6% gain for Total Bond Market Index (VBTLX). Vanguard’s most aggressive multi-index fund, Target Retirement 2070 (VSNVX), is up 12.6% for the year, and its most conservative, LifeStrategy Income (VASIX), is up 3.8% for the year.
Until my next IVA Weekly Brief, this is Jeff DeMaso wishing you a safe, sound and prosperous investment future.
Not a Premium Member yet? Want to hear from us more often, go deeper into Vanguard, get our take on individual Vanguard funds, access our Portfolios and Trade Alerts, and more? Start a free 30-day trial now.